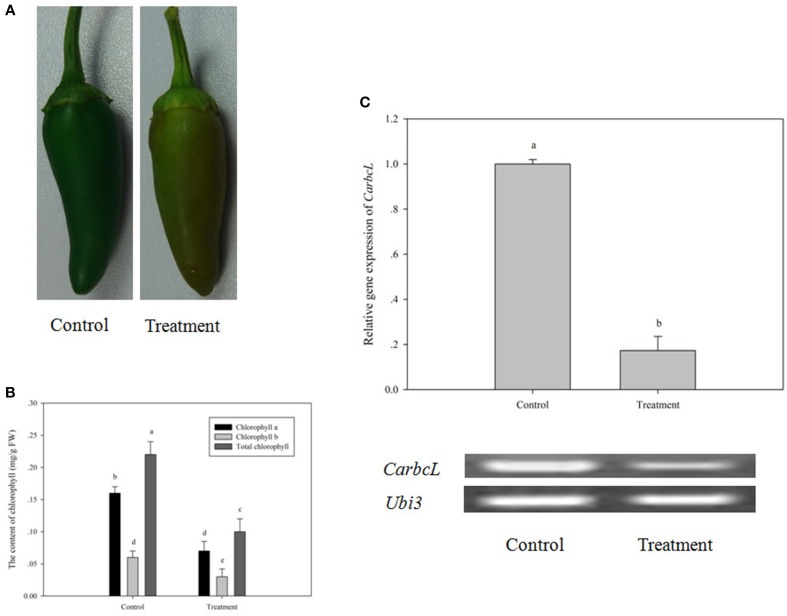
Figure 6.
Changes in fruit phenotype, chlorophyll content and CarbcL gene expression under low light. (A) Phenotypic differences in fruits of the control and treatment groups. (B) Differences in the chlorophyll content of fruits in the control and treatment groups. (C) Gene expression differences in fruits of the control and treatment groups; Control: the control group (Fruits with no shade stress), Treatment: the treatment group (Fruits with shade stress). LSR analysis at 5% is shown in lowercase letters (a and b). Means with the same letter are not significantly different. All experiments were carried out in triplicate.

