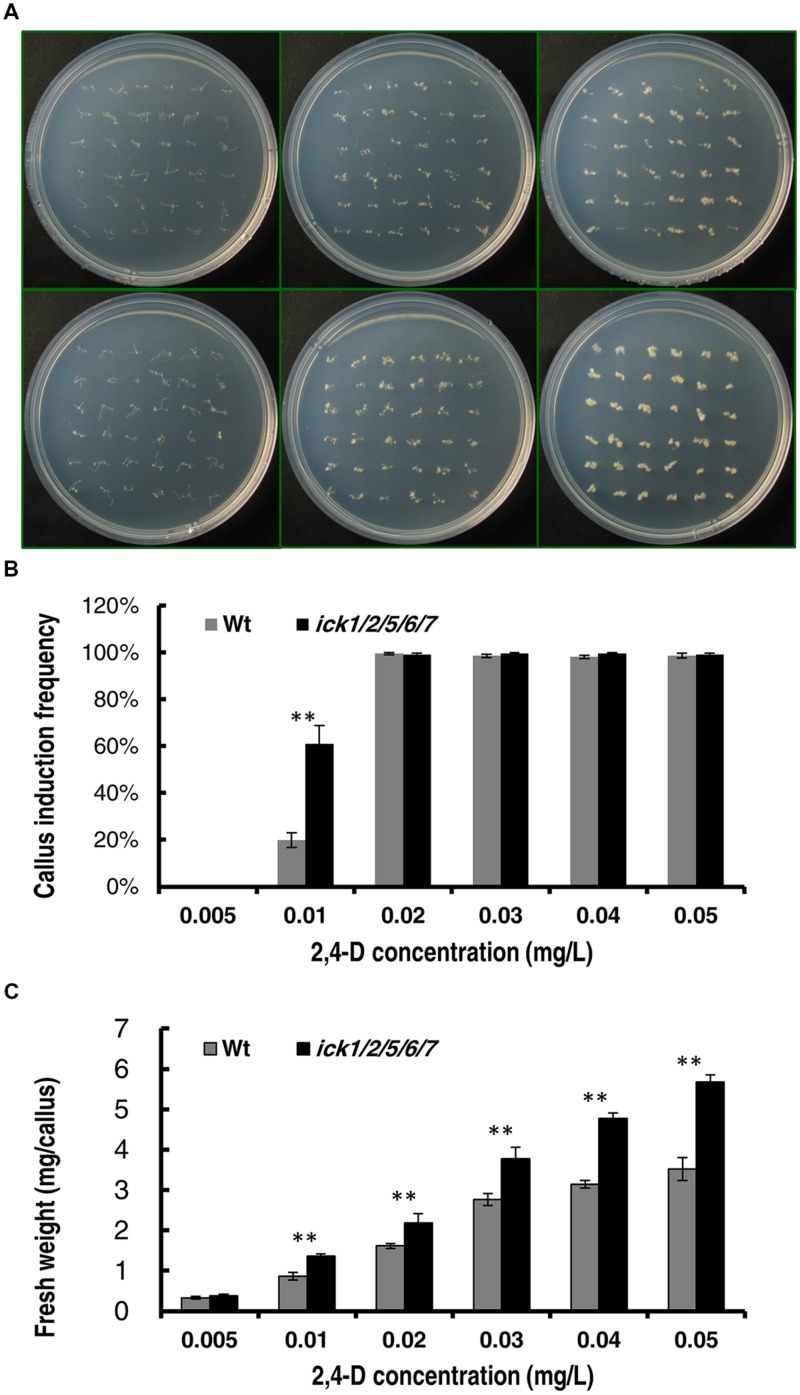
FIGURE 3.
Callus induction from root explants of the Wt and ick1/2/5/6/7 mutant at different 2,4-D concentrations. Root segments were cultured on 1/2 MS medium containing the indicated concentrations of 2,4-D for 20 days. (A) Representative plates showing the root explants of Wt (the upper row) and ick1/2/5/6/7 mutant (the lower row) on 1/2 MS medium containing 0.05, 0.01, and 0.05 mg/L (the first–third column, respectively) 2,4-D. (B) Callus induction rate of root explants of Wt and ick1/2/5/6/7 mutant after 20 days of culture. (C) Fresh weight of root explants with callus of Wt and ick1/2/5/6/7 after 20 days of culture. The bars show the mean values of 4–5 plates. Student’s t-test was used for analyzing the differences in induction rate and fresh weight between the Wt and mutant (error bar = SE; ∗∗P < 0.01).

