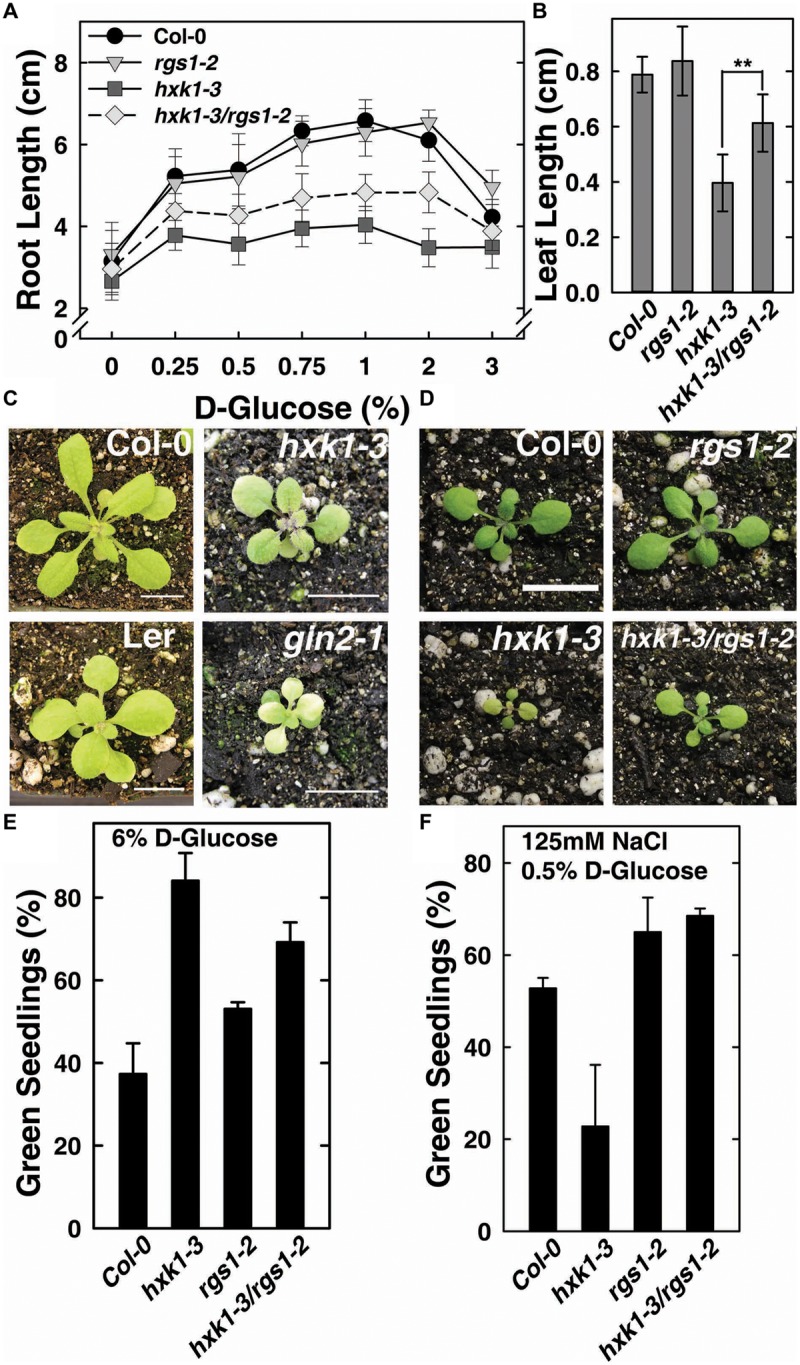
FIGURE 2.

hxk1-3/rgs1-2 double mutants show intermediate growth phenotype between hxk1-3 and rgs1-2 sngle mutants. (A) Comparison of root elongation of Col-0, rgs1-2, hxk1-3, and hxk1-3/rgs1-2 mutant seedlings transferred to1/4 MS medium supplemented with 0, 0.25, 0.5, 0.75, 1, 2 or 3% D-glucose (w/v) under low intensity light (70 μmol s-1 m-2) in long-day chamber in 16/8 h (L/D). Values are means ± SD (n = 10–18). (B) Comparison of leaf size (the third leaf) of 2-week-old Col-0, rgs1-2, hxk1-3, and hxk1-3/rgs1-2 mutant seedlings grown under light (160 μmol s-1 m-2) in 16/8 h (L/D). Values are means ± SD (n = 10–12). ANOVA single factor analysis (α = 0.05) was conducted to compare the leaf size in hxk1-3and hxk1-3/rgs1-2. ∗∗P < 0.01. (C) 3-week-old Col-0, hxk1-3, Ler, and gin2-1 plants grown under high intensity light (160 μmol s-1 m-2) in 16/8 h (L/D). Scale bar = 1 cm. (D) 2-week-old Col-0, hxk1-3, rgs1-2, and hxk1-3/rgs1-2 mutant plants grown under high intensity light (160 μmol s-1 m-2) in 16/8 h (L/D). Scale bar = 1 cm. (E) Green seedling assay of the Col-0, rgs1-2, hxk1-3, and hxk1-3/rgs1-2 mutant. The assay was performed as described in Section “Materials and Methods.” The average percentage of seedlings showing green cotyledons was determined and presented with means ± SD from one representative experiment of 4 biological replications. (F) Col, rgs1-2, hxk1-3, and rgs1-2/hxk1-3 have altered responses to saline stress. The assay was performed as described in Section “Material and Methods.” Values are means ± SD from quintuplicate.
