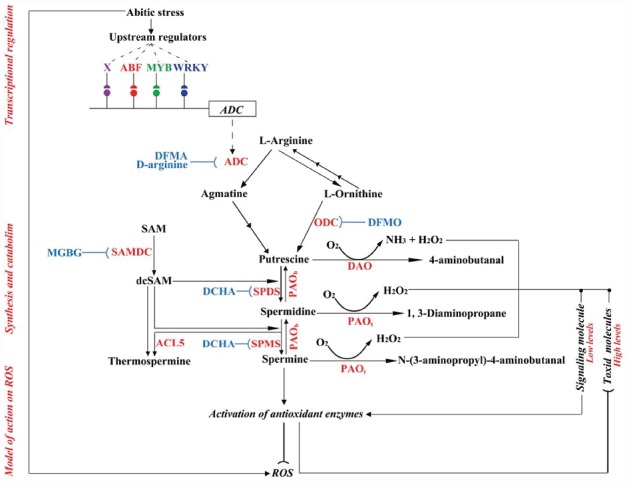
FIGURE 1.
A schematic diagram on synthesis, catabolism, regulation, and action of plant polyamines under abiotic stresses. The enzymes are shown in red, while the inhibitors of the polyamine biosynthetic enzymes are shown in blue. PAOt indicates the PAO simplicated in terminal metabolism, whereas PAOb is involved in back conversion. Circles indicate the relevant cis-acting elements within the ADC promoter. ADC coding sequence is boxed, and the promoter is shown by the horizontal line. X is an unknown transcription factor that regulates the expression of ADC gene. Arrows mean promotion or stimulation, whereas blunted arrows indicate inhibition, of the related processes. The dashed arrow shows the translation from the ADC gene to ADC protein/enzyme.

