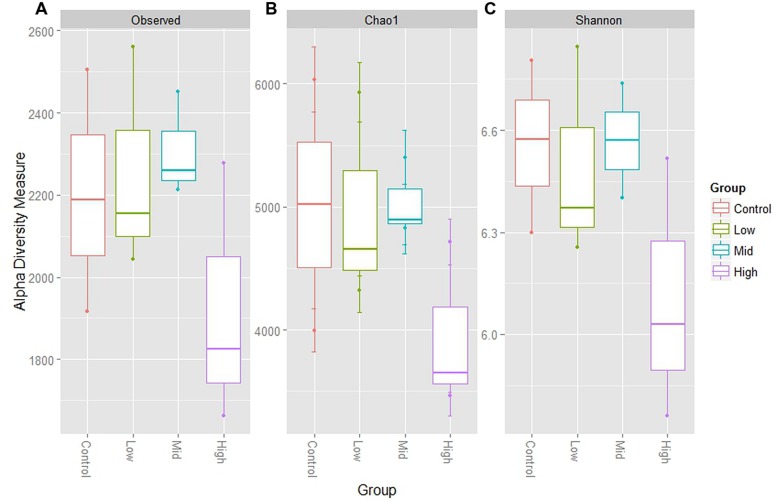
FIGURE 1.
Alpha diversity measures for goat rumen microbiomes at control, low, mid, and high doses of BCM. (A) Shows total observed taxonomic units, (B) the Chao1 estimates and, (C) the Shannon diversity index. Boxplots indicate the first and third quartiles with the median value indicated as a horizontal line the whickers extend to 1.5 times the inter quartile range.

