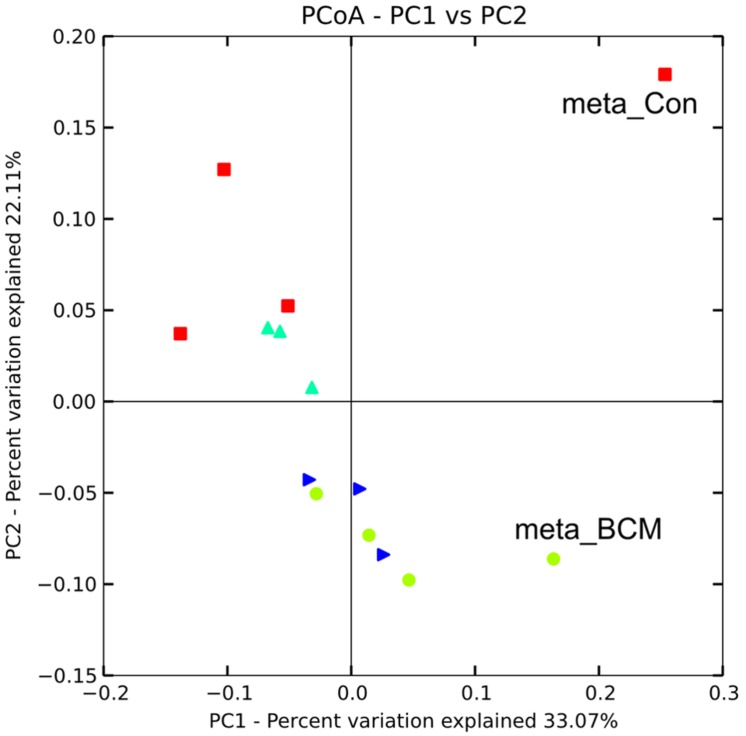
FIGURE 3.
Weighted Unifrac diversity principal coordinate analysis of 16S rDNA amplicon generated rumen microbiomes and 16S rDNA sequences extracted from metagenomic sequencing for animals on varying levels of BCM for control (red square), low dose (turquoise triangle), mid dose (blue right triangle), high dose (green circle). Point’s labeled meta_con and meta_BCM indicate 16S rDNA sequences obtained from metagenomic sequencing of pooled animal samples for the control and high BCM period, respectively.

