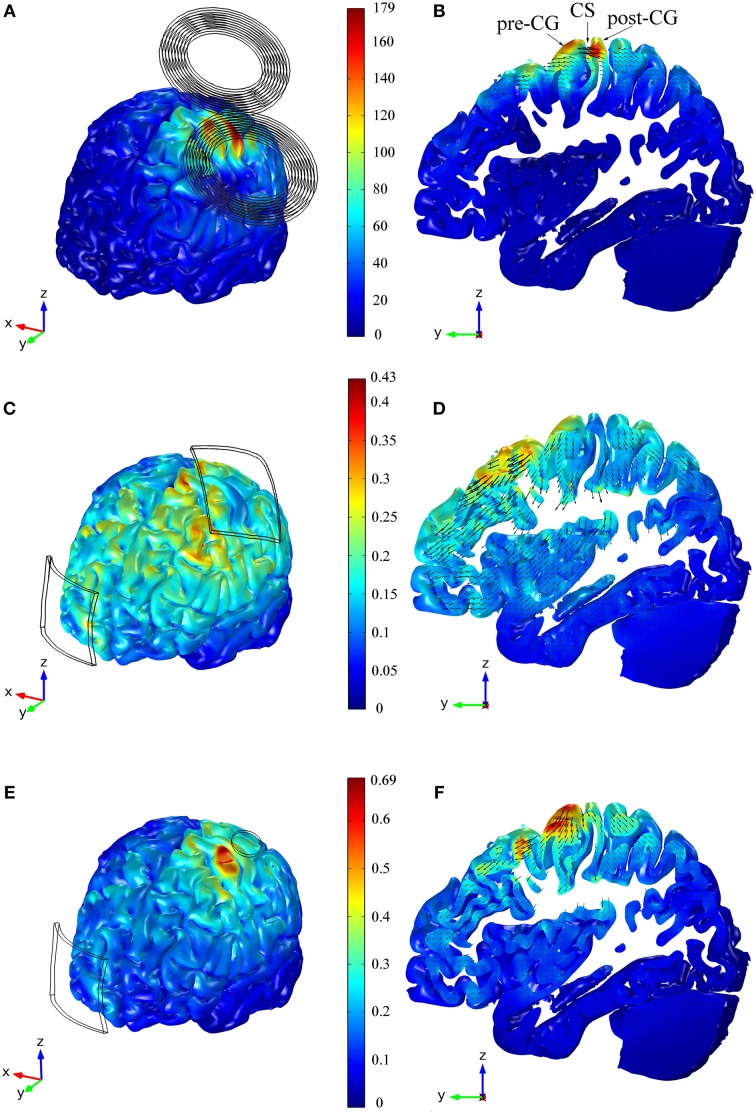
Figure 2.
Distribution of the E-field's magnitude induced during TMS (A,B), tDCS with the 35 cm2 electrode (C,D) and tDCS with the π cm2 anode (E,F). The figures in the left column show the E-field's magnitude in the GM volume, whereas the figures in the right column show the E-field's distribution in a sagittal view of a slab of GM tissue with a thickness of 1.3 cm and passing through the HK and PMd regions. The figures within the same row share the same color scale (E-field's magnitude in V/m). The figures in the right column also show vector plots of the projection of the E-field in the depicted sagittal plane. Panel (B) also shows the location of the central sulcus (CS), pre and post-central gyrus (pre-CG/post-CG).

