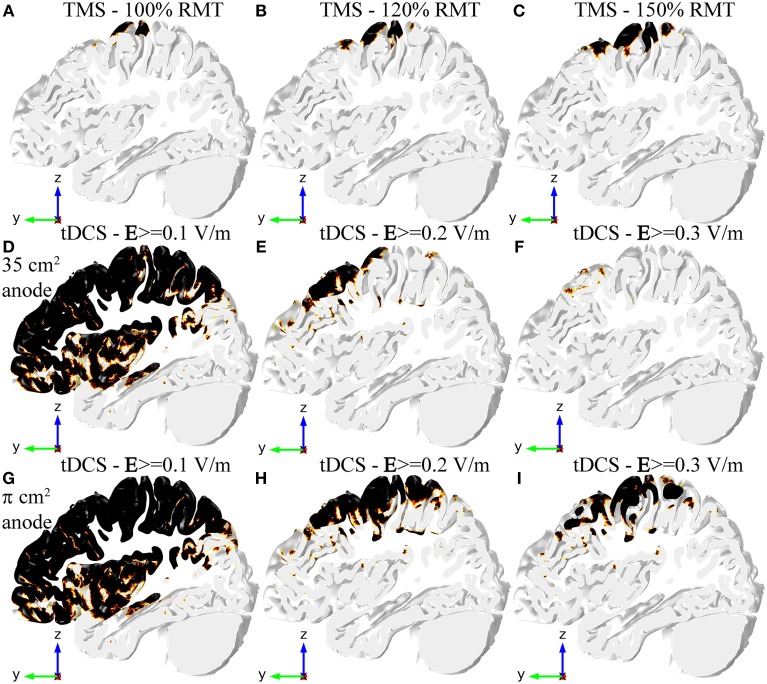
Figure 3.
Regions in the GM volume where the field is above a specified threshold in TMS (A–C), tDCS with the 35 cm2 electrode (D–F), and tDCS with the π cm2 anode (G–I). Regions shown in black are above threshold. The region selected is the same slab of GM tissue passing through the HK and PMd shown in Figure 2. The threshold for TMS was set to 100 V/m in all figures, but the stimulator output was set to 100% RMT (A), 120% RMT (B) and 150% RMT (C). The threshold for tDCS was set to 0.1 V/m (D,G), 0.2 V/m (E,H) and 0.3 V/m (F,I).

