Figure 1.
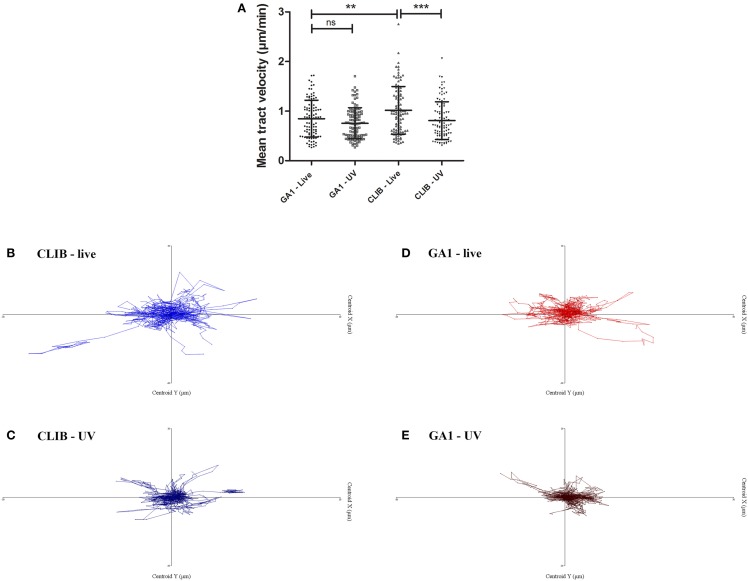
Macrophage migration toward C. parapsilosis GA1 and CLIB 214. J774 murine macrophages were challenged with live or UV-treated C. parapsilosis GA1 or CLIB 214 cells and were tracked individually using Volocity 6.3 software in defined time intervals. Mean track velocity values were calculated (mean ± SD) in μm/min (A). Tracking diagrams show the movement and distances traveled by phagocytes relative to their starting position after culturing with live (B) or UV-killed (C) CLIB 214, and live (D) or UV-treated (E) GA1 cells. One-way ANOVA analysis with Bonferroni's multiple comparison test was used to determine statistical relevance. **p < 0.01; ***p < 0.001.

