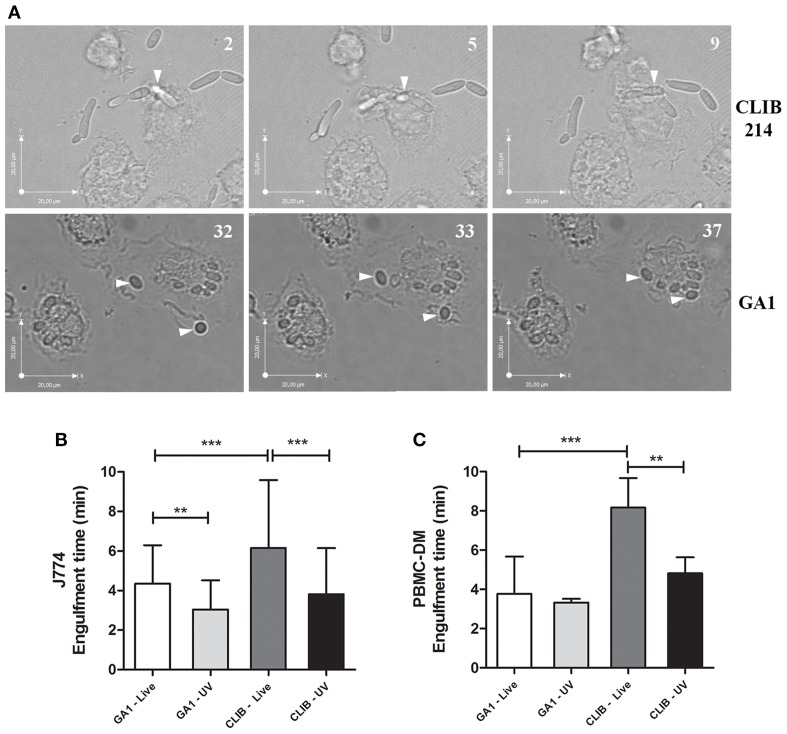
Figure 2.
Engulfment time of GA1 and CLIB 214 by macrophages. Representative images show the full internalization of C. parapsilosis CLIB 214 (A, upper panel) and GA1 cells (A, lower panel) by human PBMC-derived macrophages. Numbers at the upper right corner of pictures show the time (minutes) of observed individual events. Arrows show the fungal cells internalized by phagocytes. Diagrams show the average time (mean-values + SD) in minutes required for the full ingestion of live or UV-treated GA1 and CLIB 214 cells by J774 (B) and PBMC-derived macrophages (C). One-way ANOVA analysis with Bonferroni's multiple comparison test was used to determine statistical significance. Significant differences were considered at p-values **p < 0.01; ***p < 0.001. Scale bar: 20 μm.

