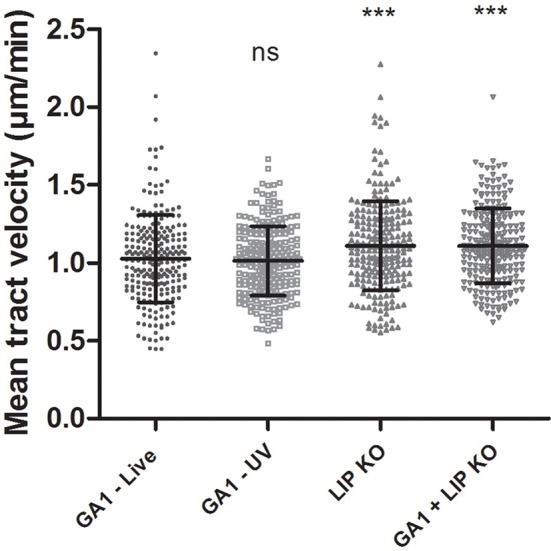
Figure 6.

Macrophage migration toward GA1, CpΔΔlip1 − ΔΔlip2 or GA1, and CpΔΔlip1 − ΔΔlip2 cells. J774 murine macrophages were followed for 6 h after co-culturing with GA1 or CpΔΔlip1 − ΔΔlip2 cells individually, and after GA1 and CpΔΔlip1 − ΔΔlip2 simultaneous infections. Phagocyte mean track velocity values (mean ± SD) are shown in μm/min. One-way ANOVA analysis with Bonferroni's multiple comparison test was used to determine statistical relevance. Significance was determined relative to the wild type. Different gray symbols represent the mean tract velocity of individual macrophages. ***p < 0.001.
