Figure 8.
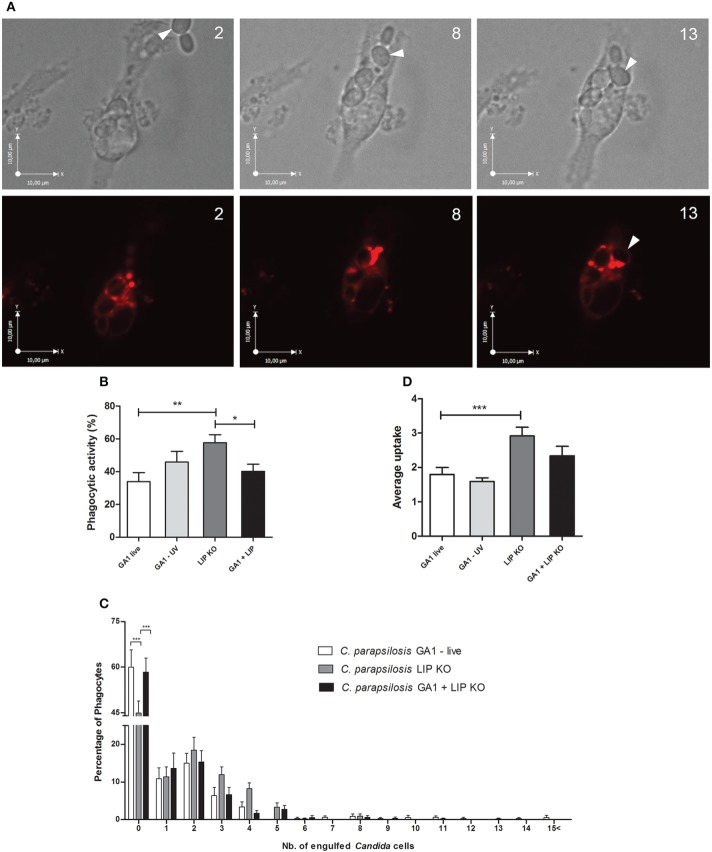
Overall uptake of GA1 and CpΔΔlip1 − ΔΔlip2 by J774 macrophages. On Panel (A) bright field and fluorescent microscopic images show the internalization of CpΔΔlip1 − ΔΔlip2 cells (arrows) by a J774 murine macrophage. Phagocyte was stained with Lysotracker Red. Numbers indicate the duration of time (min) from recognition until the complete ingestion of cells. Scale bar: 10 μm. Panels (B–D) represent the overall uptake of fungal cells showing phagocytic activity (mean + SEM; B), defined number of fungal cells taken up by phagocytes (mean + SEM; C) and average uptake (mean + SEM; D). Data for phagocytic activity and average uptake were analyzed using One-way ANOVA with Bonferroni's post-test. Two-way ANOVA analysis with Bonferroni's multiple comparison test (column to column comparison) was applied to determine significant differences between the distribution of fungal cells per macrophages. Significant statistical differences: *p < 0.05; **p < 0.01; ***p < 0.001.

