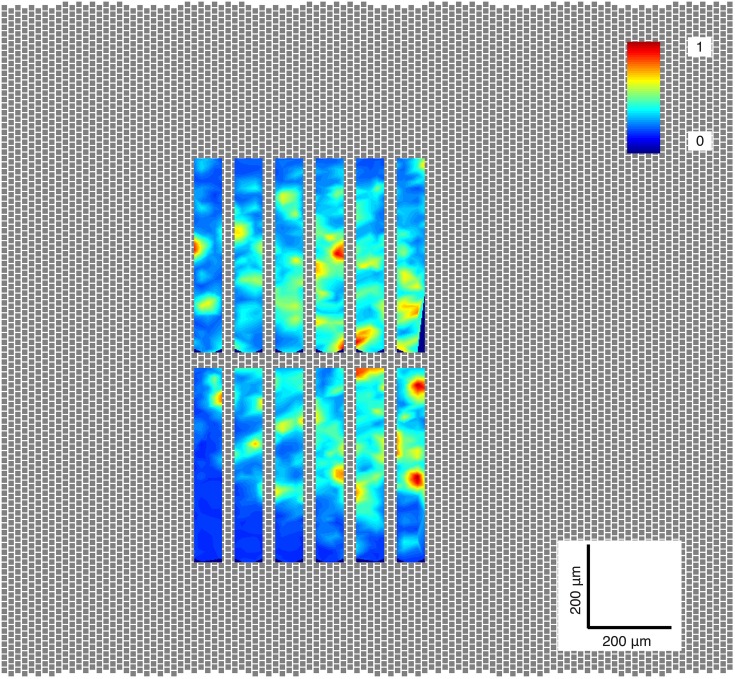
Figure 2.
Activity scan. The location on the retina piece with the greatest number of ganglion cells was selected for each experiment. The electrodes of the MEA are shown as gray squares; the retina lies on top of these electrodes, 126 of which can be selected to simultaneously record ganglion cell activity. In this case, each rectangle shown in this image was generated by recording from a selected group, or configuration, of 126 electrodes. The colors represent the normalized peak-to-peak amplitude of the neurons found in each region.

