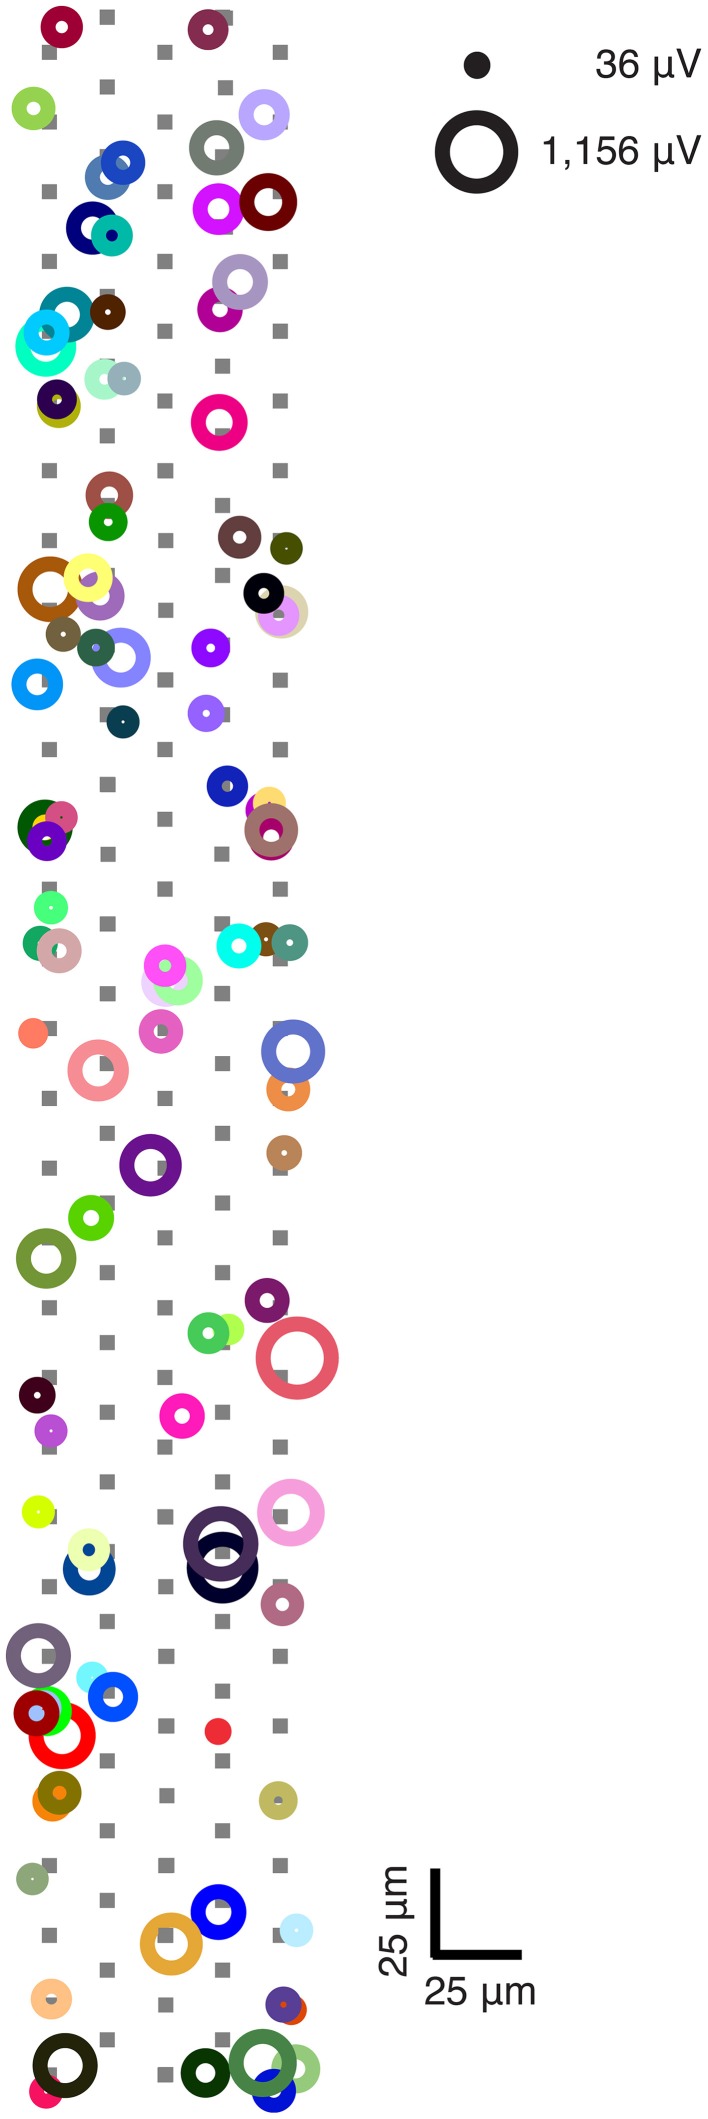
Figure 4.
Ganglion cell distribution and signal amplitudes within selected region of retina piece. Each colored circle represents a unique spike-sorted ganglion cell that was recorded throughout one experiment and responded to at least one stimulus. The area of each circle represents each cell's peak amplitude. Locations of circles indicate the electrode where the peak amplitude of the spike-triggered average extracellular action potential (STA-EAP) were recorded. A ± 5 μm spatial jitter along the x- and y-axes was introduced into the plot to avoid circle overlaps. Overlaps occurred because the peaks of multiple ganglion cells were recorded on one electrode, which suggests that the axon initial segments of multiple neurons were closest to a given electrode. One electrode configuration was used to obtain this data: electrodes underlying cells are shown in filled gray squares. Note that not all electrodes shown in figure were used for recording.

