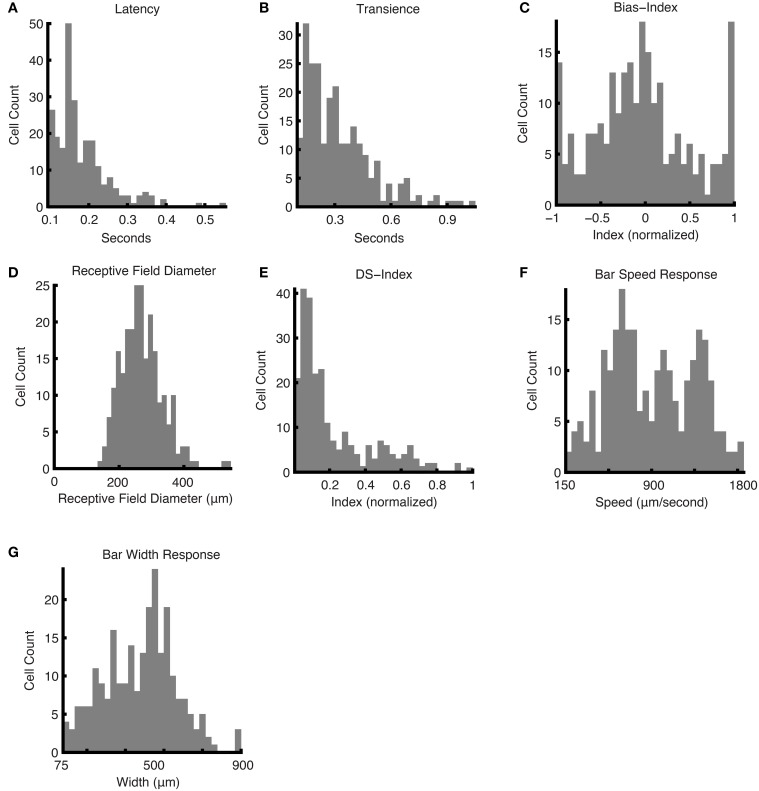
Figure 6.
Responses and parameters. Histograms of responses and calculated parameters, showing the distributions for the entire dataset. The following were obtained using the responses to the Marching Square Over Grid stimulus: (A) latency values, (B) transience values, (C) bias indices, and (D) mean receptive field diameters. (E) The DS indices were computed using the Narrow Moving Bars stimulus in eight directions. (F) The bar speed response was computed from the responses to a moving bar at different speeds. (G) The bar width response was computed from moving bars with a range of widths.

