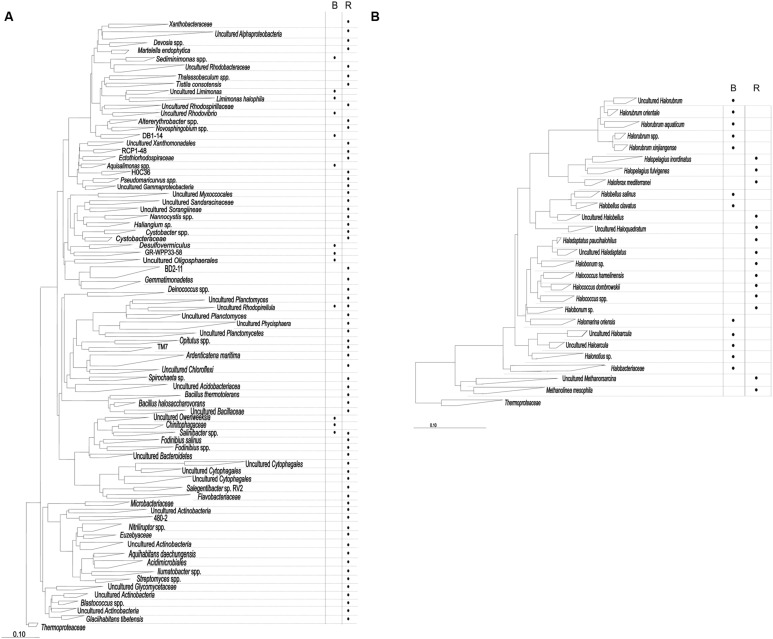
FIGURE 1.
16S rRNA phylogenetic reconstruction for bacterial (A) and archaeal (B) sequences. The presence of OPUs with abundances >0.5% in each sample type (B = brines; R = rhizosphere) is indicated with a dot. Each OPU results from the phylogenetic inference resulting from the parsimony insertion of representatives of each sequence cluster at 99% identity, each representing independent OTUs.

