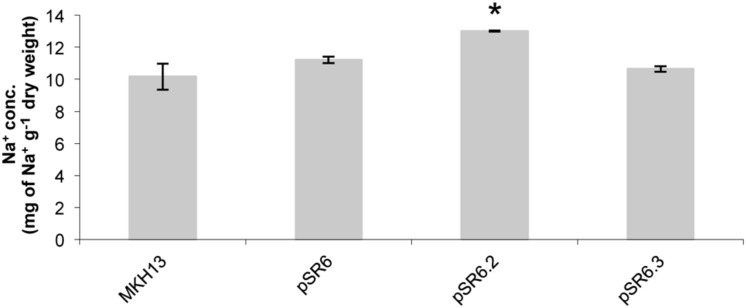
FIGURE 8.
Test for cellular content of Na+ ion in E. coli clones pSR6, pSR6-orf2, pSR6-orf3, and MKH13-pSKII+ after 1 h of growth with 6% NaCl. Values are the averages of two independent ICP-MS measurements. Error bars indicate standard deviation. An asterisk indicates significantly different from pSR6, pSR6-orf3 and control cells as determined by one-way ANOVA followed by Tukey’s test (p < 0.05).

