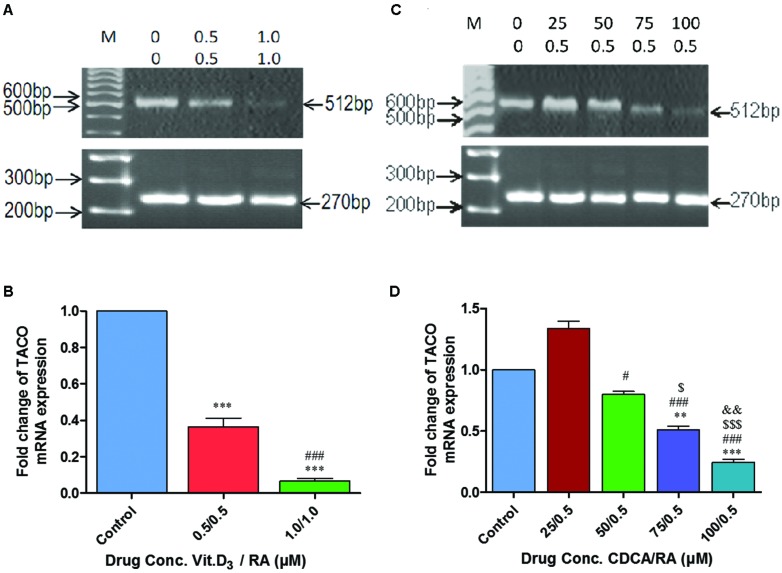
FIGURE 6.
Polymerase chain reaction (PCR) amplification showing synergistic action of Vitamin D3/Retinoic acid (Vit.D3/RA) and chenodeoxycholic acid/Retinoic acid (CDCA/RA) on mRNA expression of TACO gene. (A,C) Representative agarose gel photographs showing ethidium bromide stained Real Time PCR products of TACO and GAPDH genes. (B,D) The relative levels of TACO mRNA expression represented in fold change. Each data point in the graph represents mean ± SD of three independent experiments. ***p < 0.001 (Control Vs 0.5/0.5 μM; 1.0/1.0 μM), ###p < 0.001 (0.5/0.5 μM Vs 1.0/1.0 μM), ***p < 0.001 (Control Vs 75/0.5 μM; 100/0.5 μM), #p < 0.05, ###p < 0.001 (25/0.5 μM Vs 50/0.5 μM; 75/0.5 μM; 100/0.5 μM), $ p < 0.05, $$$ p < 0.001 (50/0.5 μM Vs 75/0.5 μM; 100/0.5 μM), &&p < 0.05 (75/0.5 μM Vs 100/0.5 μM).

