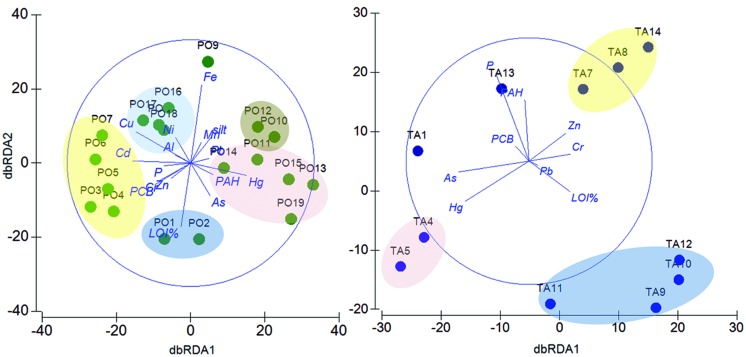
FIGURE 6.
Relationships between environmental variables, contaminants and taxonomic composition within each site. dbRDA ordinations of the distLM model which describe the relationship between the environmental variables (P, % LOI, silt content), the chemical contaminants (Al, As, Cd, Cr, Cu, Fe, Hg, Mn, Ni, PAHs, Pb, PCBs, and Zn) and the taxonomic composition at the OTU level in the Po River Prodelta (Left) and Mar Piccolo of Taranto (Right) sites. In the Po River Prodelta plot, the first axis (dbRDA1) captures 19.1% of the fitted and 17.1% of the total variation between the samples’ taxonomic profile, while the second (dbRDA2) captures 8.1% of the fitted and 7.2% of the total variation. In the Mar Piccolo of Taranto plot, the first axis (dbRDA1) captures 22.4% of the fitted and 18.1% of the total variation between the samples’ taxonomic profile, while the second (dbRDA2) captures 20% of the fitted and 16.2% of the total variation. Green circles: Po River Prodelta samples. Blue circles: Mar Piccolo of Taranto samples.

