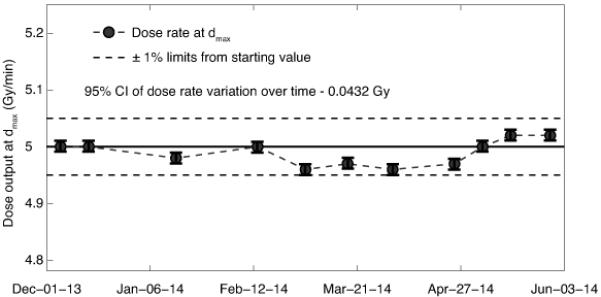
Figure 4.

Long-term dose output consistency showing the dose rate to water at dmax. The solid line shows the dose rate at the starting date (5.0 Gy/min) and dashed lines show the ±1% limits from the starting value, uncertainty bars represent 95% confidence intervals of the dose measurements.
