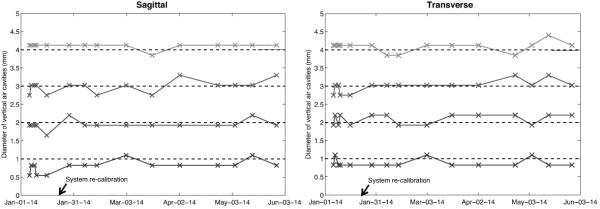
Figure 5.

Data showing the diameters of the air resolution cavities varying in size from 1 to 4 mm, as derived from the CBCT images, in the transverse and sagittal plane respectively. The dashed lines represent the true diameter of the air cavities and the black arrow marks the date of the full system re-calibration.
