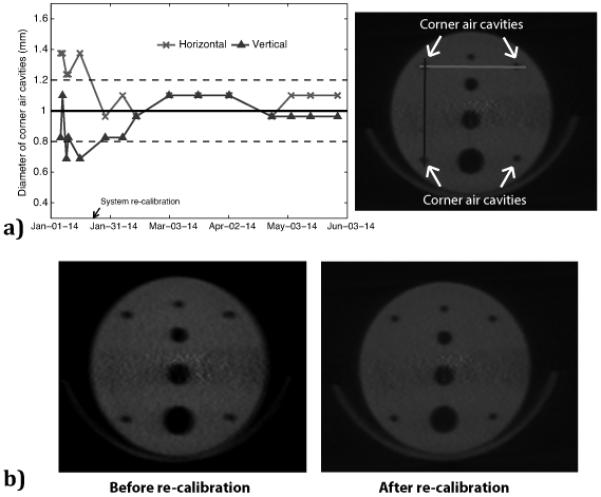
Figure 6.

a) The left hand panel shows the corner air cavity diameters estimated from the CBCT images (average of two corner cavities), where the solid line shows the true value of 1 mm and the dashed lines represent a variation of ±0.2 mm in resolution consistency. The right hand panel shows an image of the resolution air cavities with corresponding line profiles of horizontal diameters (light grey line) and vertical diameters (dark grey line). b) Visual example of poor image resolution (left hand panel), especially evident in the horizontal direction, compared to good image resolution (right hand panel).
