Figure 7.


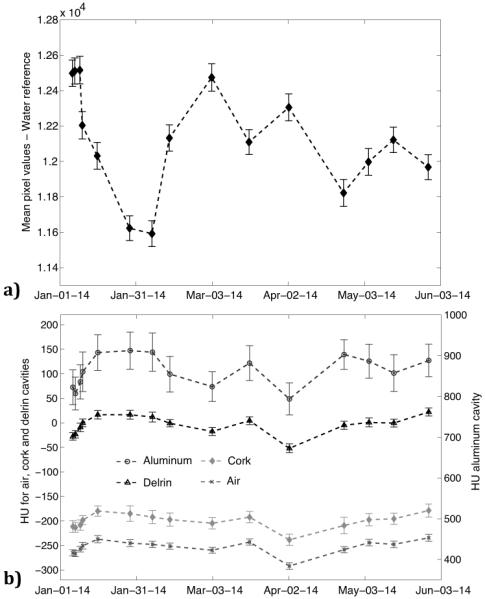
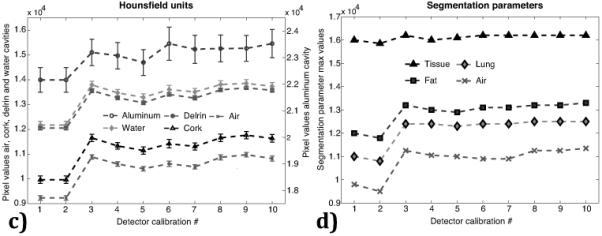
The change in mean pixel value intensity over time for the water reference is presented in (a) and the change in mean Hounsfield units over time is presented for the air, cork and polyethylene regions of interest (left axis) and for the aluminum (right axis) in (b). The variation in Hounsfield units is presented in (c) and parameters for tissue segmentation in (d) from subsequent detector calibrations. Uncertainty bars represent one standard deviation of the pixel values in the respective region of interest measurements.
