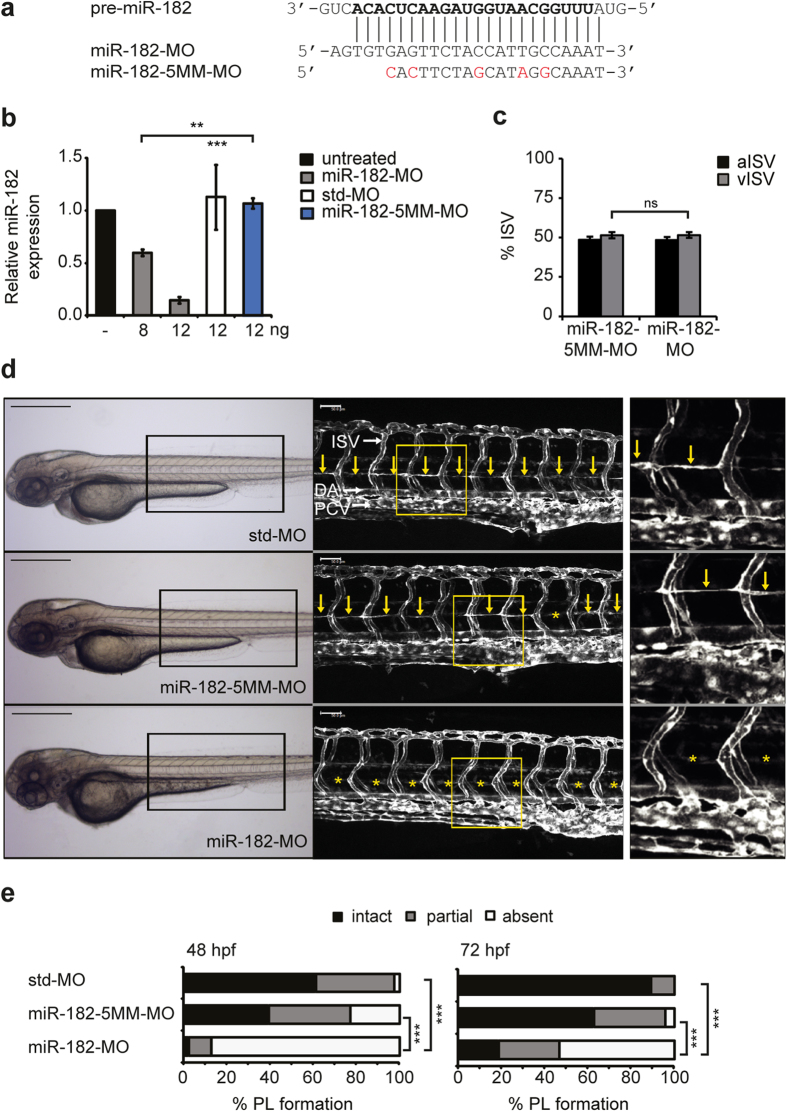
Figure 4. miR-182 expression silencing recapitulates the Junb knockdown PL phenotype.
(a) Sequences of the guide strand of targeted pre-miR-182 and of miR-182 (miR-182-MO) and 5-mismatch control (miR-182-5MM-MO) morpholinos used. Nucleotides of mature miR-182 and substituted nucleotides of miR-182-5MM-MO are marked in bold and red, respectively. (b) Dose-dependent knockdown of miR-182 as determined by Taqman miRNA assay in 48 hpf zebrafish embryos following injection of miR-182-MO, std-MO or miR-182-5MM-MO using the indicated MO concentrations. Data are normalized to U6 snRNA and expressed as mean ± SEM (n = 3). ***P < 0.001, **P < 0.01, Unpaired Student’s t-test for comparison to miR-182-5MM-MO. (c) Quantification of arterial and venous ISVs (aISV, vISV) given as % aISV and vISV in Tg(fli1:EGFP)y1 zebrafish embryos injected with indicated morpholinos at 72 hpf given as % aISV and % vISV. Mean ± SD. ns, not significant, Student’s t-test. (d) Left panel, representative bright field images of zebrafish embryos 72 hpf injected with miR-182-MO (12 ng, n = 151) compared to std-MO (12 ng, n = 107) and miR-182-5MM-MO (12 ng, n = 139). Middle panel, confocal images of trunk vasculature in respective embryonic region marked by rectangle on the left. Right panel, enlarged view of trunk region marked by the yellow rectangle in the middle panel. DA, dorsal aorta, PCV, posterior cardinal vein and ISV, intersegmental vessels. PL is marked with yellow arrows or if absent with asterisks. Panels are lateral view; dorsal is up, anterior to the left. Scale bars: 500 μm (black) and 50 μm (white). (e) Percentage of PL defects in embryos at 48 hpf and 72 hpf. ***P < 0.001, Mann-Whitney U-test.

