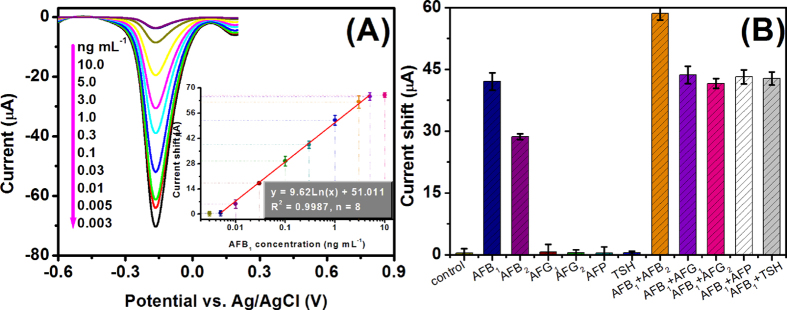
Figure 6.

(A) DPV response curves of PtNPs/CoTPP/rGO-based non-enzymatic electrochemical immunoassay toward different-concentration AFB1 standards in pH 7.0 PBS containing 50 μM H2O2 (Inset: Calibration plots), and (B) the specificity of the developed immunoassay against target AFB1 (0.1 ng mL−1), AFB2 (0.1 ng mL−1), AFG1 (0.1 ng mL−1), AFG2 (0.1 ng mL−1), AFP (50 ng mL−1) and TSH (50 ng mL−1). Each data point represents the average value obtained from three different measurements.
