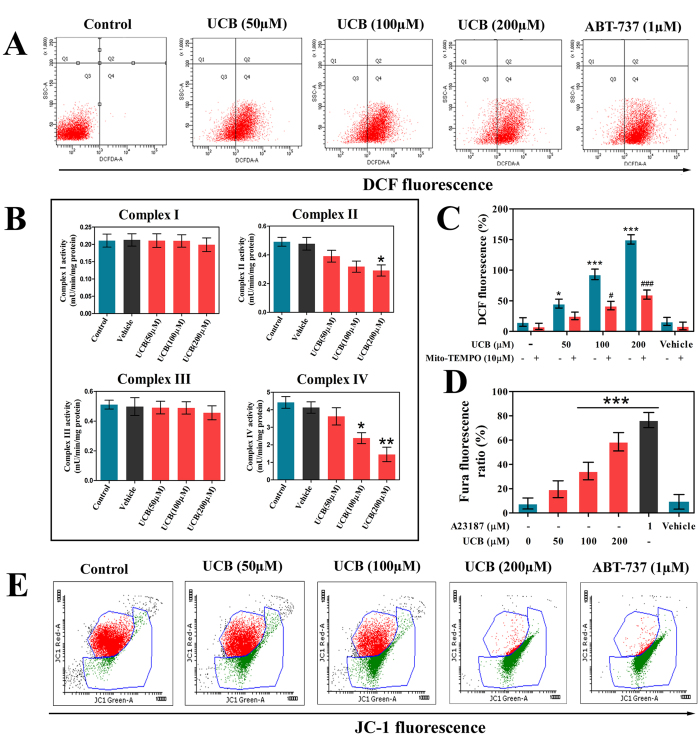
Figure 1. UCB induced oxidative stress and mitochondrial stress in human platelets.
(A) Flow cytometric analysis of ROS in UCB treated platelets, (B) Effect of UCB on components of mitochondrial electron transport chain, (C) Effect of Mito-TEMPO on UCB induced ROS generation. (D) Flourometric analysis of intracellular calcium level and (E) Flow cytometric analysis of mitochondrial membrane potential. Values are presented as mean ± SEM (n = 5) and expressed as percentage increase in (C) DCF and (D) Fura fluorescence. */# p< 0.05, **p < 0.01, ***/### p< 0.001; *significant compared to control platelets; #significant compared to UCB alone treated platelets.

