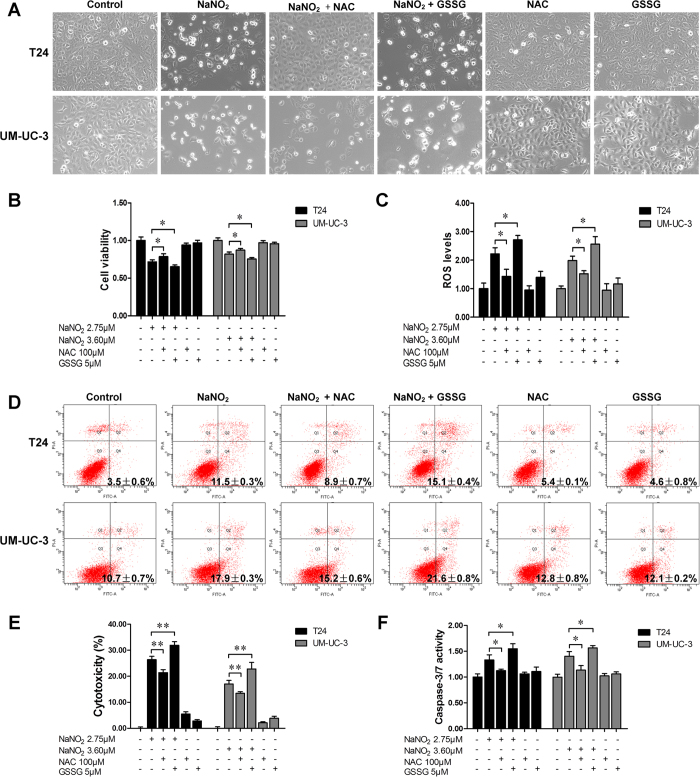
Figure 5. Effects of NAC and GSSG on NaNO2-induced cell growth suppression and apoptosis.
(A) NaNO2-induced apoptosis in T24 and UM-UC-3 cells. T24 and UM-UC-3 cells were pretreated with 100 μM NAC or 5 μM GSSG for 24 h and then treated with or without NaNO2 (2.75 μM for T24 and 3.60 μM for UM-UC-3). The cells were visualized by microscopy (100×). (B) Cell survival assay. (C) After pretreatment with 100 μM NAC or 5 μM GSSG for 24 h, cells were treated with or without NaNO2 for 6 h. The ROS level was then determined. Apoptosis (D), cytotoxicity (E) and caspase-3/7 activity (F) were analyzed according to the distributions for the treatments in (A). The data are presented as the mean ± SD for at least three independent experiments. Single asterisks (*) indicate a significant difference (P < 0.05), and double asterisks (**) indicate an extremely significant difference (P < 0.01).

