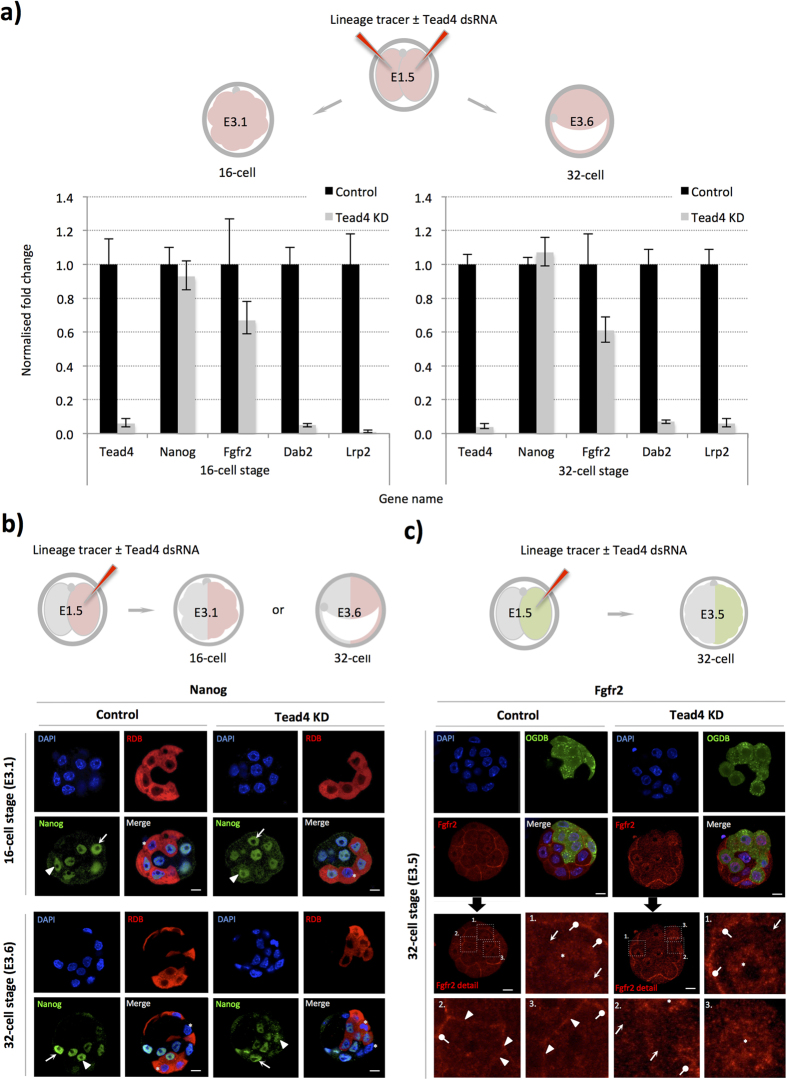
Figure 6. Global and clonal TE-inhibition; no enhanced Nanog expression prior to 32-cell stage but attenuated PrE-specific marker expression.
(a) The experimental strategy to down-regulate Tead4 and inhibit TE-differentiation throughout all cells of the embryo prior to Q-RTPCR analysis (upper). Normalised expression fold changes, resulting from Tead4-KD, of the stated transcripts at the mid-16-cell (E3.1) or 32-cell (E3.6) stages (lower panels). Individual gene mRNA levels were normalised against Rpl23 and/or H2afz transcript levels within control and experimental knockdown conditions prior to fold change calculation. Errors = s.e.m, n = at least 2 for biological and 3 for technical replicates (n.b. Tead4 specific data is repeated from Fig. 1 as Q-RTPCR was performed from same cDNA preparations). (b) Confocal microscopy analysis of Nanog (green) expression after clonal Tead4-KD at the mid-16-cell (E3.1) and 32-cell (E3.6) stages. Arrows and arrow-heads denote exemplar Nanog expression in non-microinjected and microinjected clones, respectively. Asterisks highlight TE cells without Nanog expression reflecting previously characterised inter-cell heterogeneity. (c) Confocal microscopy analysis of Fgfr2 (red) expression after clonal Tead4-KD at the non-cavitated 32-cell (E3.5) blastocyst stage. Representative single z-plane confocal micrographs are shown (middle panels) with the lower 4 panels detailing magnified anti-Fgfr2 immuno-stained images, according to numbered regions of interest. Arrow-heads highlight plasma membrane associated Fgfr2 between neighbouring ICM cells (control embryos) and arrows approximate equivalent regions of other neighbouring ICM cells without anti-Fgfr2 signal (illustrating heterogeneous Fgfr2 expression within control embryo ICMs). Similarly, arrows show ICM cell boundaries between cells of the microinjected clone devoid of Fgfr2 in Tead4-KD embryos. Asterisks and lollipop markers, in both control and Tead4-KD embryos, show nuclear Fgfr2 protein (especially in Tead4-KD embryos) or expression at the interface of TE and ICM cells, respectively. In both (b,c) progeny cells of microinjected clones are distinguishable by co-injected RDBs (red) or OGDBs (Oregon-green dextran beads—green). DNA was counterstained with DAPI (blue) and scale bars = 10 μm.

