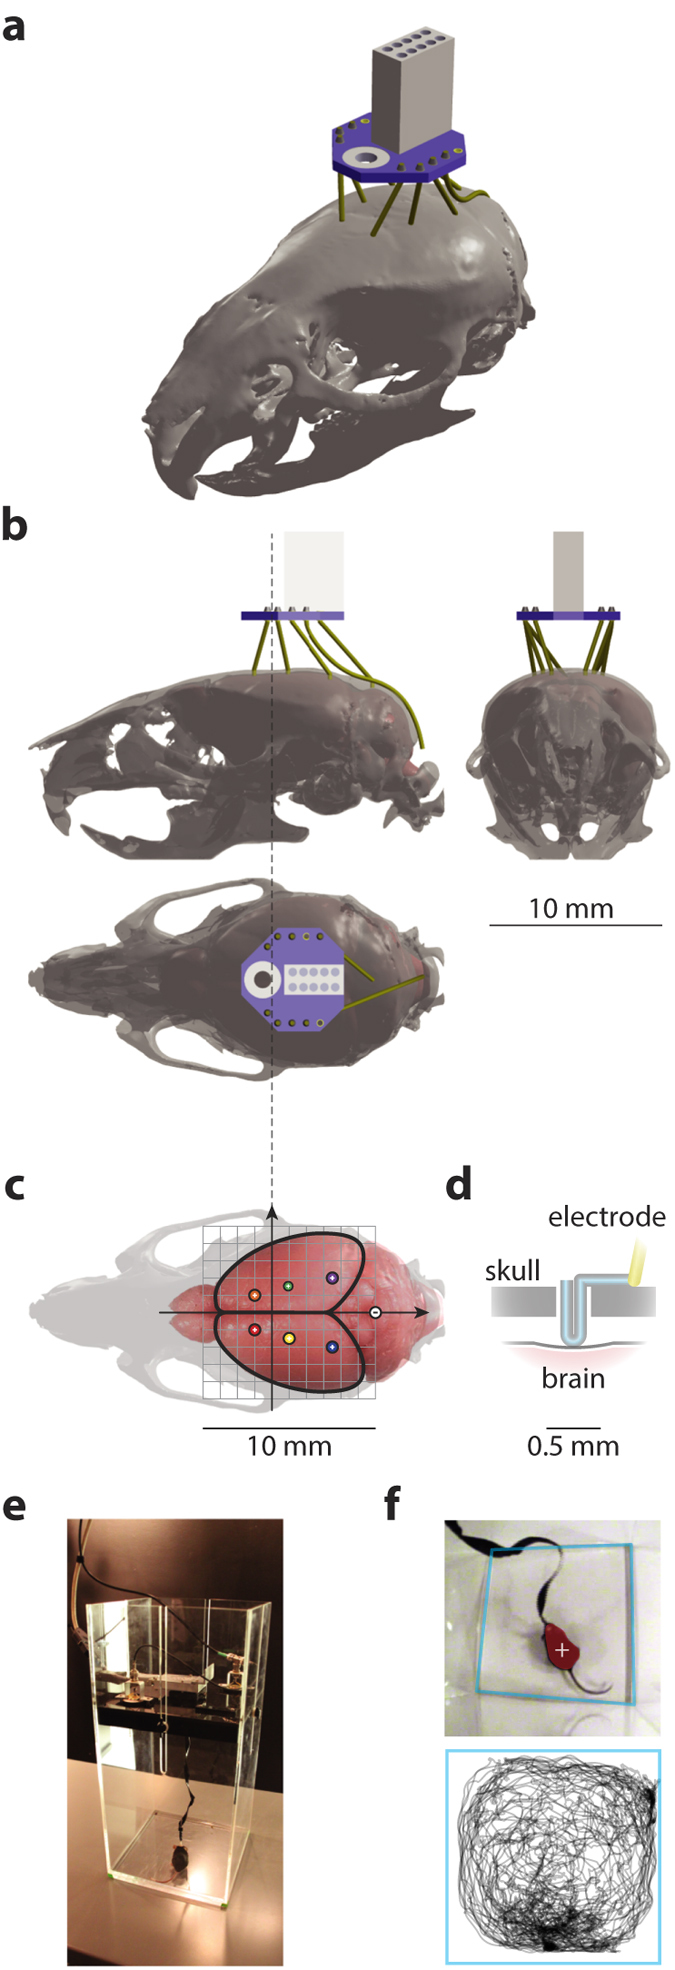
Figure 1. Physical setup of the recording apparatus.

(a) A 3D projective rendering of the implant device on top of the skull of an adult C57Bl/6J mouse with epidural electrodes resting in craniotomies of the exact stereotaxic coordinates. For clarity, jewelry screws and dental acrylic for mechanical fixation were omitted from the illustration. The implanted electrodes (yellow) were interfaced through a board (Neuralynx EIB-8, blue) with an Omnetics nano connector (white). The implant contained in total 7 epidural EEG electrodes and 1 subcutaneous EMG electrode. 3D model assembled from components obtained from the Henderson 3D surgical atlas 24 and the EIB-8 model from Neuralynx (see Methods for procedural details of the physical assembly). (b) Three-view diagrams of the assembly of the skull (transparent gray) and brain (pink solid) with the 3D model of the implant device. (c) A top-view of the positioning of epidural electrodes (colored circles, recording electrodes labeled with a plus sign and the reference electrode a minus sign) on the surface of the brain (pink). The scale of this diagram is exactly the same as in (b); a millimeter grid (gray) is overlaid on top of the brain and solid arrows represent the major anatomical axes; the extending dashed line mark the antero-posterior position of bregma. (d) A diagram of a vertical section of a craniotomy showing how an epidural electrode rests on the cranium with its tip contacting the dural surface. Insulation (yellow) of the electrode wire was stripped at the tip. (e) A 25 by 25 cm2 recording chamber designed for the experiments, picture showing a C57Bl/6J mouse being tested. A wired tether, interfaced through a pre-amplifier and a slip-ring commutator at its two ends, carried recording signals; two passive speakers and a camera were mounted on the ceiling of the chamber to deliver sensory stimuli and to monitor animal behavior. (f) A frame captured by the monitoring camera (top), showing tracking of the center-of-mass (white cross) of the detected animal (red shade) in an automated way. Boundaries of the recording chamber (light blue) were detected offline so that the real-world coordinates of the animal’s positions could be reconstructed (bottom, showing the trajectory of the animal during an hour).
