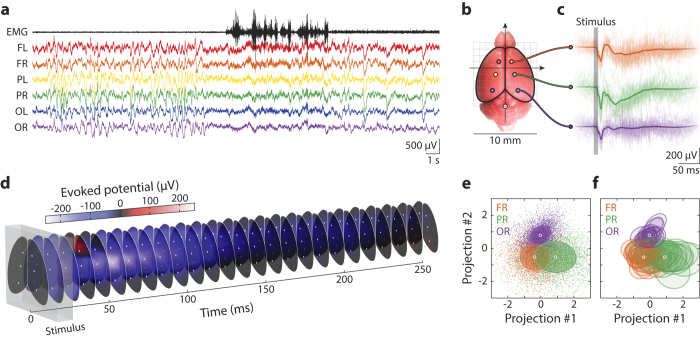
Figure 2. Recordings of spatio-temporal auditory ERPs from behaving mice at high accuracy, precision and reliability.
(a) A 30-second clip of epidural EEG and subcutaneous EMG signals recorded from a freely behaving animal; the record shows a sleep-wake transition in the middle of the clip, demonstrating our method’s ability to record multi-channel EEG, EMG and monitor behavior simultaneously. Different EEG channels are colored in consistency with all other figures and the EMG channel is in black. Each EEG channel is identified with a two-letter label indicating its position: F – frontal, P – parietal, O – occipital, L – left, and R – right. (b) A top-view of the mouse brain showing positioning of the epidural electrodes, same as in Fig. 1c. (c) Epoched auditory ERPs recorded in channels FR (orange), PR (green) and OR (purple) from a wild type animal. Thin, transparent curves show individual trials (raw data) and thick, solid curves the average over all trials; the vertical gray bar marks the duration of the stimulus. (d) The mean spatio-temporal auditory ERP, same as in (c), over the cortical surface, visualized as a stack of spatially interpolated color maps through time. The gray box marks the duration of the stimulus. (e) Linear projections of ERPs onto the plane determined by the 3 grand averages (i.e. population means, constituting 2 spanning waveforms, #1 and #2) of channel FR, PR and OR, as shown in (c), color code consistent with all other figures. Each single trial of ERP is represented by a small, light-colored dot, and their grand averages by the white circles; colored ellipses mark the 1 σ boundaries of the covariances across all trials. Illustrated ERP trials are pooled from all 18 mice used in this study, which contained 9 wild type and 9 Sp4 hypomorphic animals. (f) The same projection plot as in (e), except that the single-trial data are replaced by the 1 σ boundaries of covariances (colored ellipses) for each of the 18 animals.

