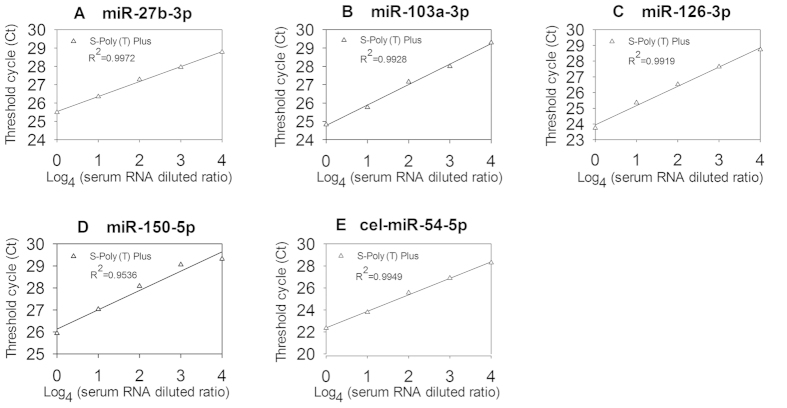
Figure 4. The correlation between total RNA inputs and threshold cycle (Ct) values of human sera as determined by S-Poly (T) Plus method.
A 0.075 μl (original) ~ 0.3 nl (diluted 44 times) of initial serum RNA, corresponding to 0.38 μl ~ 1.5 nl of human serum sample were used in each real-time PCR reaction. (A) miR-27-3p, (B) miR-103a-3p, (C) miR-126-3p, (D) miR-150-5p and (E) cel-miR-54-5p.

