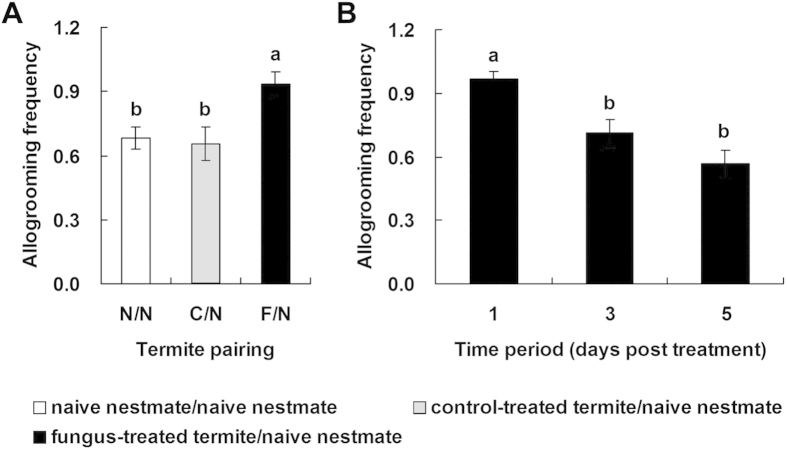
Figure 1. Observation of allogrooming behaviour for different treatment groups.
(A) The allogrooming frequency of the different treatment groups. (B) Allogrooming frequency at different times between fungus-treated termites and naive nestmates over 5 d. Pairing groups include naive nestmates (N), control-treated termites (C), and fungus-treated termites (F). Error bars represent mean ± SEM. Different letters indicate significant differences (Tukey’s HSD test, p < 0.05).

