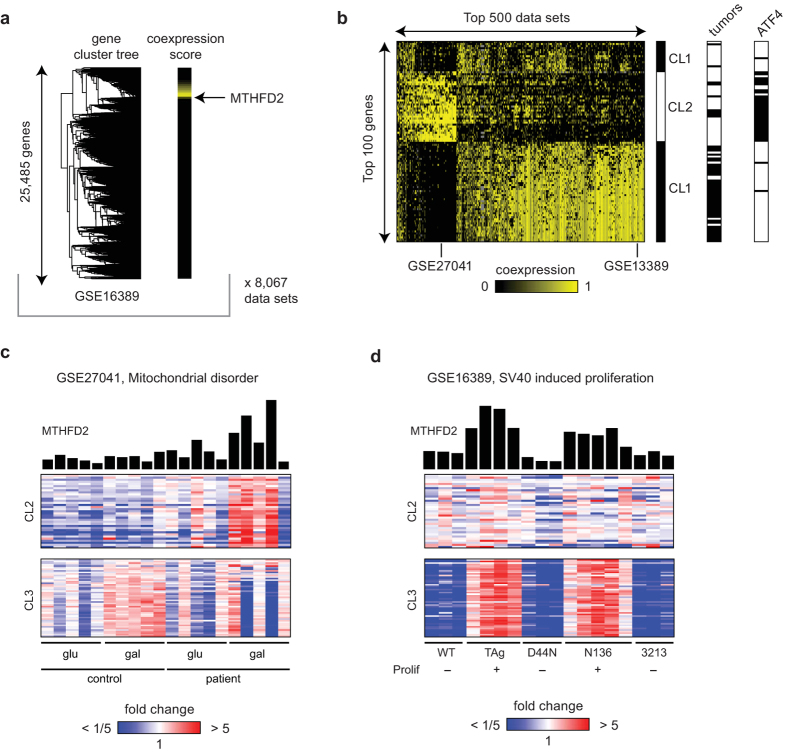
Figure 1. Coexpression analysis.
(a) Example cluster tree (left) with MTHFD2 coexpresision score derived from the tree indicated for each gene (right). (b) Matrix of coexpression scores as in (a), for top scoring data sets and genes. (c) An example data set exhibiting coexpression between MTHFD2 and the “amino acid” gene cluster. (d) An example data set exhibiting coexpression between MTHFD2 and the “proliferation” gene cluster.

