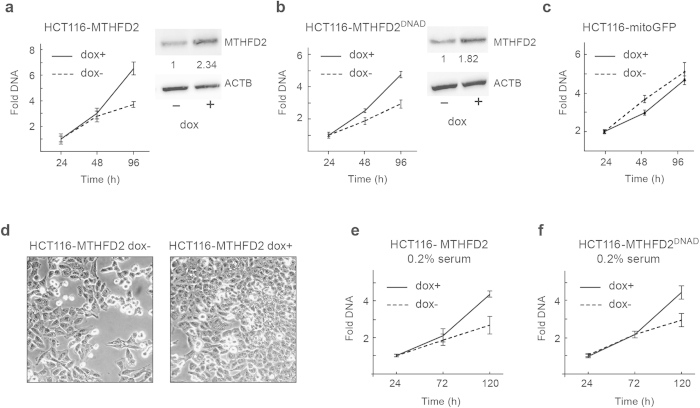
Figure 3. MTHFD2 drives cancer cell proliferation independently of its enzymatic activity.
(a–c) HCT-116 MTFHD2, HCT-116 MTHFD2ΔNAD or HCT-116 GFP cell lines cultured in medium containing 5% serum were treated +/− 1 μg/ml doxycycline and CyQuant assays of proliferation were carried out at indicated time points. Error bars are standard deviations. *P < 0.05. MTHFD2 expression was assayed by immunoblot analysis, β-Actin, ACTB, served as loading control, the images in the figure are cropped. Numbers indicate fold induction of MTHFD2 upon DOX treatment. (d) Light microscopy images of conditions as in (a) at time-point 96 hrs. (e,f) HCT-116 MTFHD2 or HCT-116 MTHFD2ΔNAD cell lines were treated +/− 1 μg/ml doxycycline for 48 hours to induce MTHFD2 or MTHFD2ΔNAD expression and then serum starved in 0.2% serum. CyQuant assays of proliferation were carried out at indicated time points. Error bars are standard deviations. *P < 0.05.

