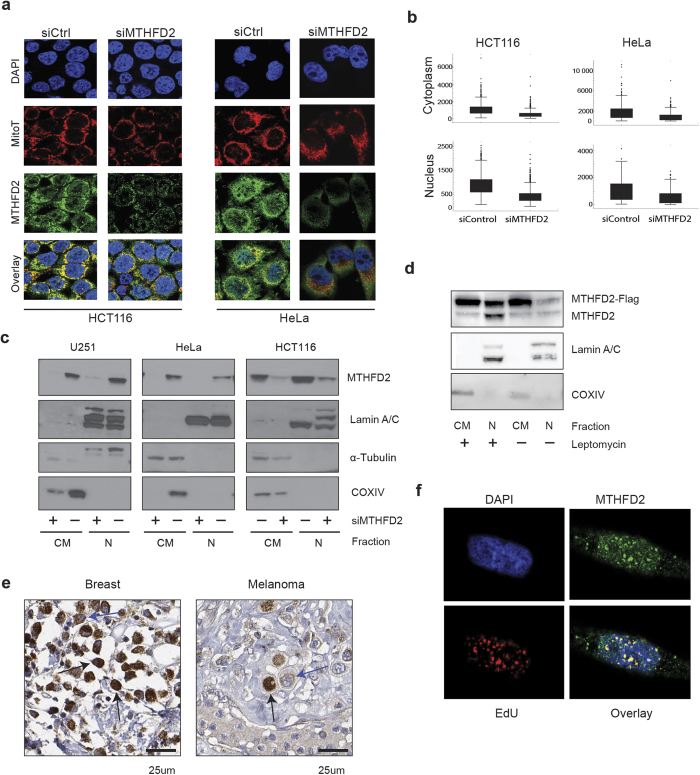
Figure 4. MTHFD2 is present in the cell nucleus and localizes to DNA synthesis sites.
(a) HCT-116 or HeLa cells were transfected with 10 nM siMTHFD2 or siControl for 48 hours, fixed, permeabilised and stained for MTHFD2, DNA (DAPI) and mitochondria (MitoT). A representative image for each condition is shown. (b) Boxplot diagram showing quantification of nuclear and cytoplasmic localization of MTHFD2 at each condition as described in Materials and Methods. The fluorescence intensity was calculated for at least 200 cells per condition and per cell line. (c,d) Cropped immunoblot analysis of MTHFD2 in nuclear and cytosolic fractions. Lamin A/C was used as nuclear marker, α-Tubulin as cytosolic marker and COXIV as a mitochondrial marker to exclude mitochondrial contamination of nuclear fractions. (c) HCT-116, U-251 and HeLa cells transfected with MTHFD2 siRNA (+) or control siRNA (−). (d) HCT-116 cells transfected with 1 μg MTHFD2-FLAG plasmid for 24 hours and then treated +/− 10 ng/mL Leptomycin B for 12 hours. (e) MTHFD2 protein expression, as assessed using immunohistochemistry, in tumor cells of breast cancer and melanoma. Nuclear (black) and mitochondrial (blue) positivity indicated with arrows (f) U-251 cells were treated with EdU for 45 min prior to fixation and EdU detection using the Click-iT detection kit and MTFHD2 antibody staining. Pearson’s correlation coefficient (PCC) was calculated for correlation between EdU and MTHFD2 based on a pixel-by-pixel analysis in CellProfiler.

