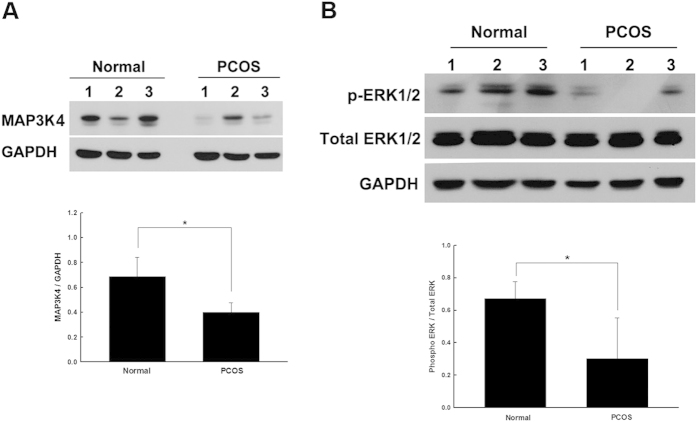
Figure 4. The activation of MAP3K4 and p-ERK1/2 was decreased in PCOS granulosa cells when compared with the non-PCOS granulosa cells.
Western blot analysis of the MAP3K4 protein (A) and the p-ERK1/2 protein (B) in the non-PCOS granulosa cells and PCOS granulosa cells. Glyceraldehyde 3-phosphate dehydrogenase (GAPDH), internal control for quantitation. Bar chart represents the quantitation of protein levels. *P < 0.05. Bars represent means ± standard deviations (SD) of data from ≥3 independent experiments. In (A,B) relevant parts of Western blot images were cropped from full-length blots shown in Fig. S1.

