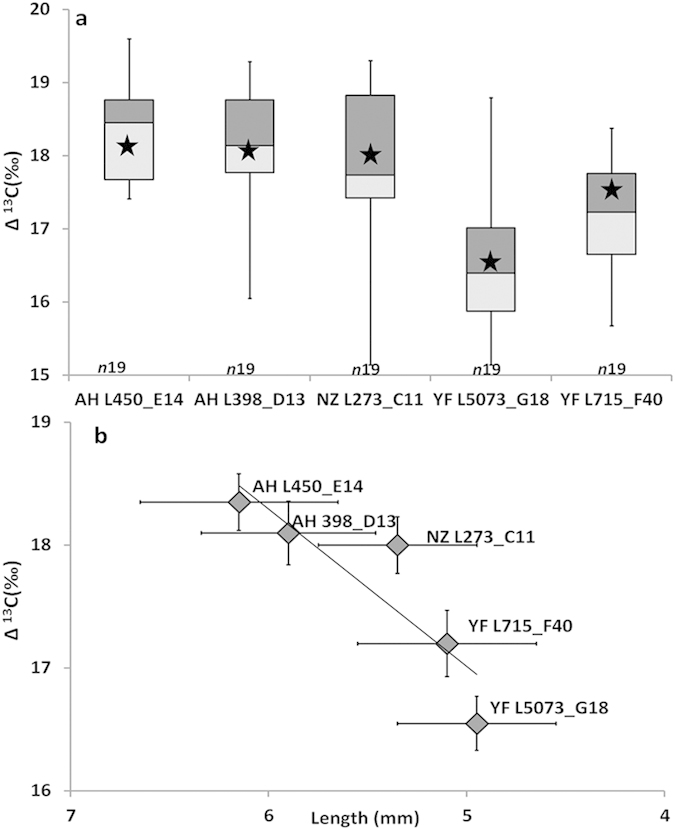
Figure 6.

The Δ 13C of faba bean over the time. (a) n) is the number of seed measured, the bottom whisker represents the minimum, the bottom line of the lighter box represent the first quartile (25th percentile), the top line of the darker box represent the third quartile (75th percentile) in between them is the median line (50th percentile). The top whisker represents the maximum. The star represents the average length of each group of seeds. (b) Each square represents the average Δ13C of the faba beans from the five investigated contexts (AH = Ahihud, NZ = Nahal Zippori, YF = Yiftah’el). The plot shows the Δ13C (‰) as function of length (R2: 0,72).
