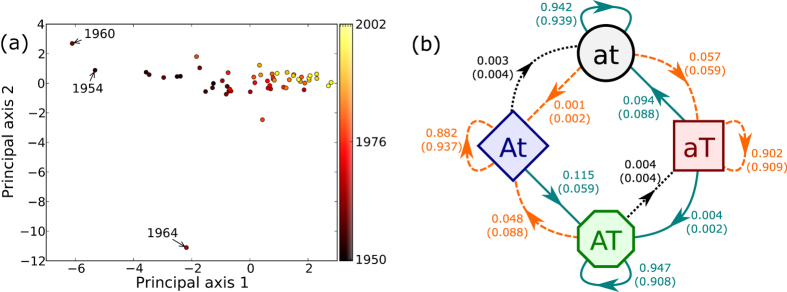
Figure 4.

(a) PCA of the yearly transition parameters. Note that with the exception of a few outliers most points appear to be similar. The color of the points correspond to the time period (b) Multiplex Markov chain obtained by aggregating the transition probabilities for several years. The value of the probability is shown on the arrows with the probability obtained from the null model within parenthesis. Transition parameters having value less than 1 × 10⁻³ are not shown. Solid (dashed) lines represent transitions with positive (negative) dynamical spillover. Dotted lines show transitions without dynamical spillover.
