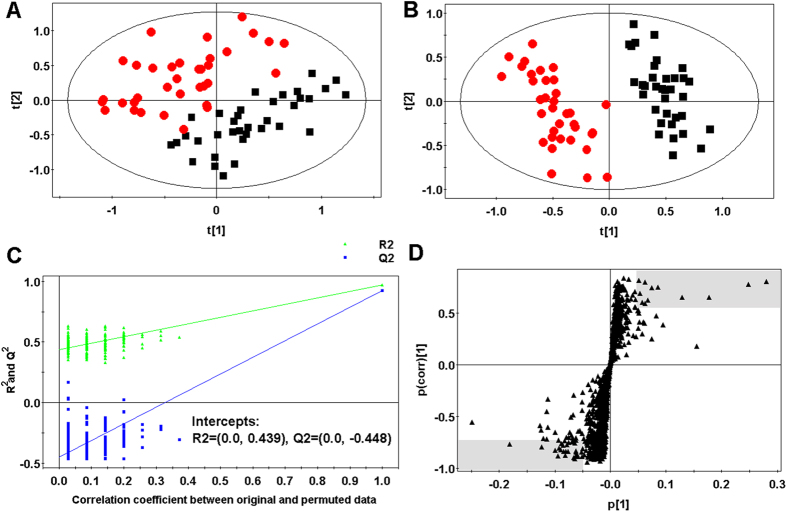
Figure 1. Multivariate data analysis.
(A) PCA score map derived from UHPLC-Q-TOFMS spectra concerning healthy (■) and HAPE ( ) individuals. (B) PLS-DA score map derived from UHPLC-Q-TOFMS spectra concerning healthy (■) and HAPE (
 ) individuals. (C) Validation plot obtained from 99 permutation tests. (D) S-plot of the PLS-DA model.

