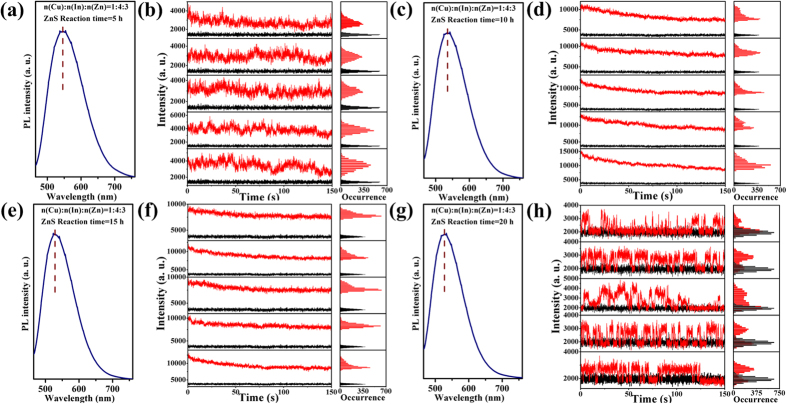
Figure 4. Ensemble and single-particle optical properties of (Zn)CuInS/ZnS QDs (Cu:In:Zn stoichiometric ratio of 1:4:3).
(a,c,e,g) PL spectra for (Zn)CuInS/ZnS QDs with different ZnS shell growth time (5, 10, 15, and 20 h, respectively). The PL curves were obtained by exciting the samples at 450 nm. (b,d,f,h) Temporal evolution of representative fluorescence-intensity trajectories for individual (Zn)CuInS/ZnS QDs with different ZnS shell growth time (5, 10, 15, and 20 h, respectively). Histograms to right indicate the corresponding distribution of intensities observed in the trajectories. All QDs were excited by continuous 488 nm Argon ion laser. The data were recorded by an EMCCD with offset correction. The binning time is 50 ms. The horizontal black line is the intensity of the background fluorescence signal.

