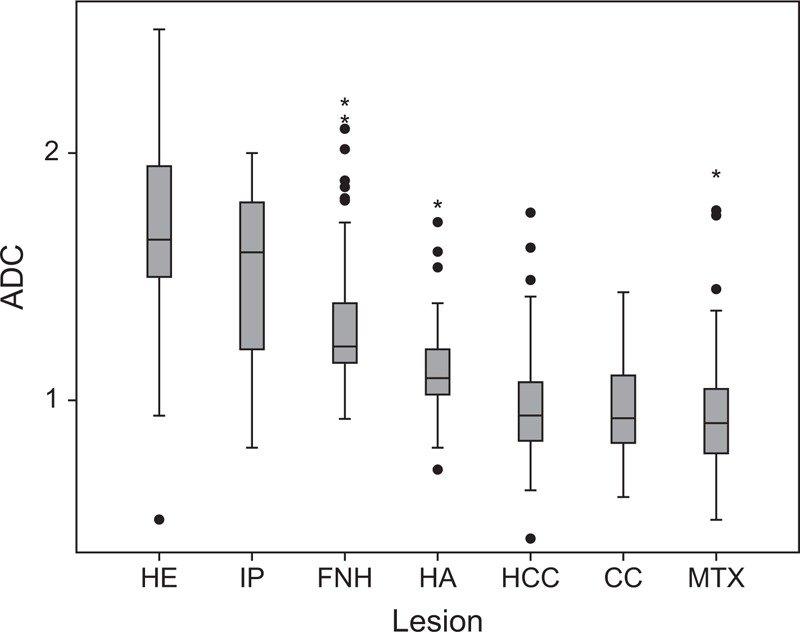
FIGURE 4.

Characterization. Box and whisker plots, respectively, of ADC values for each subgroup of lesions. The horizontal line in each box is the median of measured values. HE and FNH subgroups showed mean ADC significantly (P < 0.05) lower than all malignant subgroups. No significant differences in mean ADC were demonstrated among metastases, CC, and HCC subgroups. ADC = apparent diffusion coefficient, CC = cholangiocarcinoma, FNH = focal nodular hyperplasias, HA = hepatic adenomas, HCC = hepatocellular carcinoma, HE = hemangiomas, IP = in phase, MTX = metastases.
