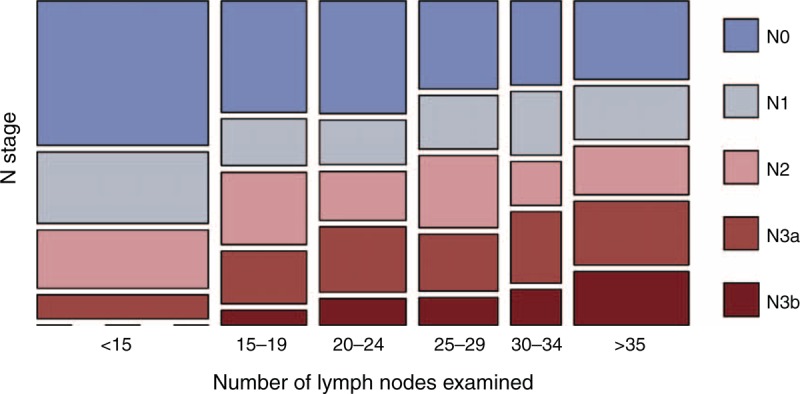
FIGURE 1.

N stage distribution according to the number of lymph nodes examined. Patients in different N stages were stratified into groups according to the number of lymph nodes examined. Each color indicates the specified N stage as shown in the color legend. The length of each box is given based on the proportion in each column or row.
