FIGURE 1.

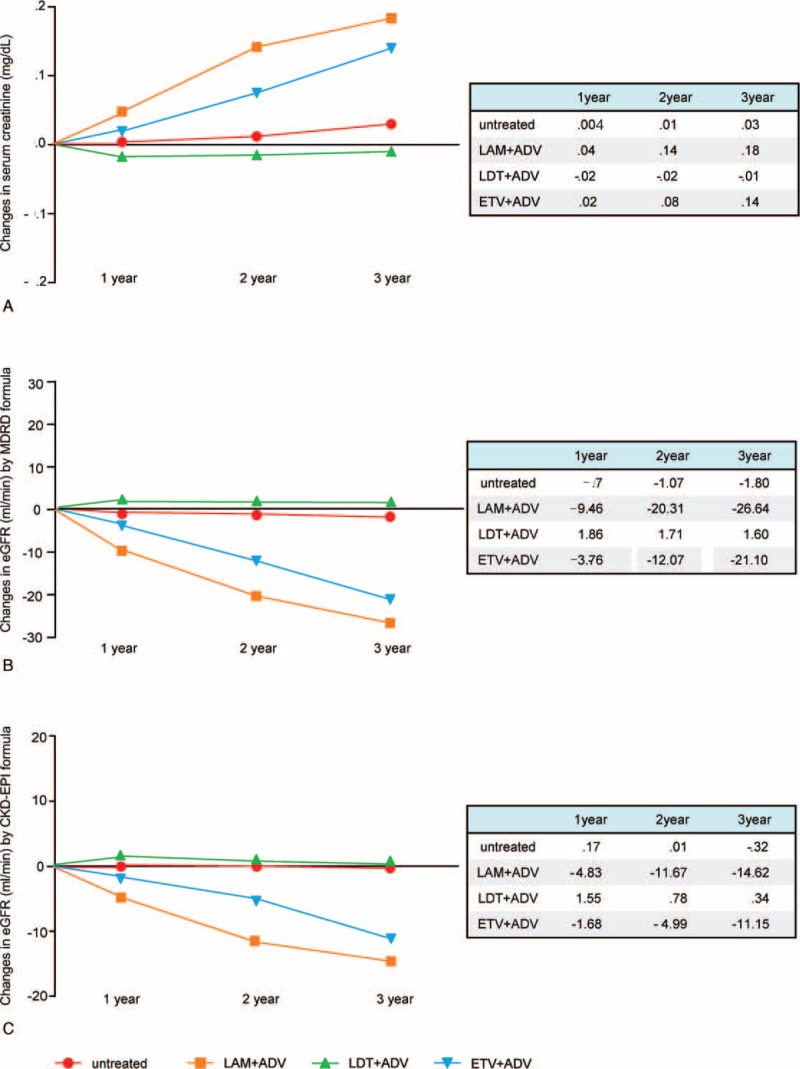
Changes in renal function-associated indicators during follow-up in patients treated with different NA combination therapies. (A) Serum creatinine; (B) eGFR calculated by the MDRD equation; (C) eGFR calculated by the CKD-EPI equation.

Changes in renal function-associated indicators during follow-up in patients treated with different NA combination therapies. (A) Serum creatinine; (B) eGFR calculated by the MDRD equation; (C) eGFR calculated by the CKD-EPI equation.