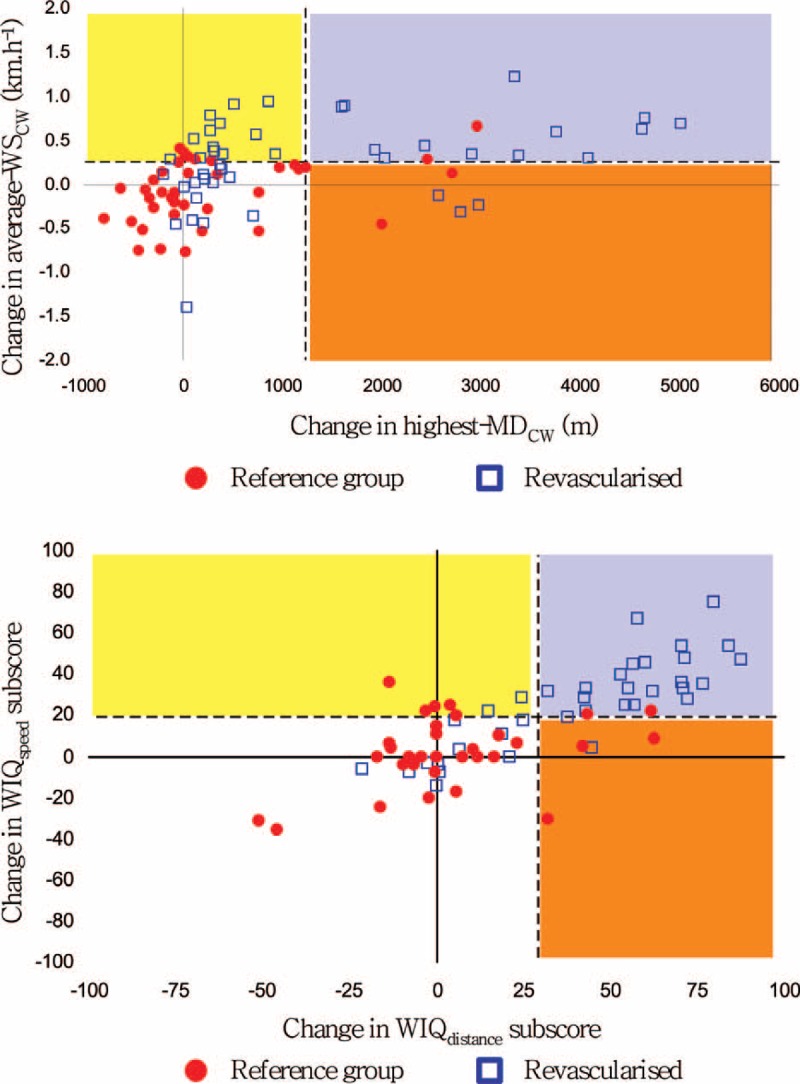
FIGURE 4.

Changes in walking speed (average-WSCW) and the highest measured distance (highest-MDCW) during a community walk among reference (red dots) and revascularized patients (blue squares). The dashed lines represent the mean + 1 SD of changes needed to detect MCII compared with reference patients. Yellow square: average-WSCW or WIQ-speed improved only; Orange square: highest-MDCW or WIQ-distance improved only; Purple square: Both average-WSCW and highest-MDCW or both WIQ-speed and WIQ-distance improved; White square: No MCII.
