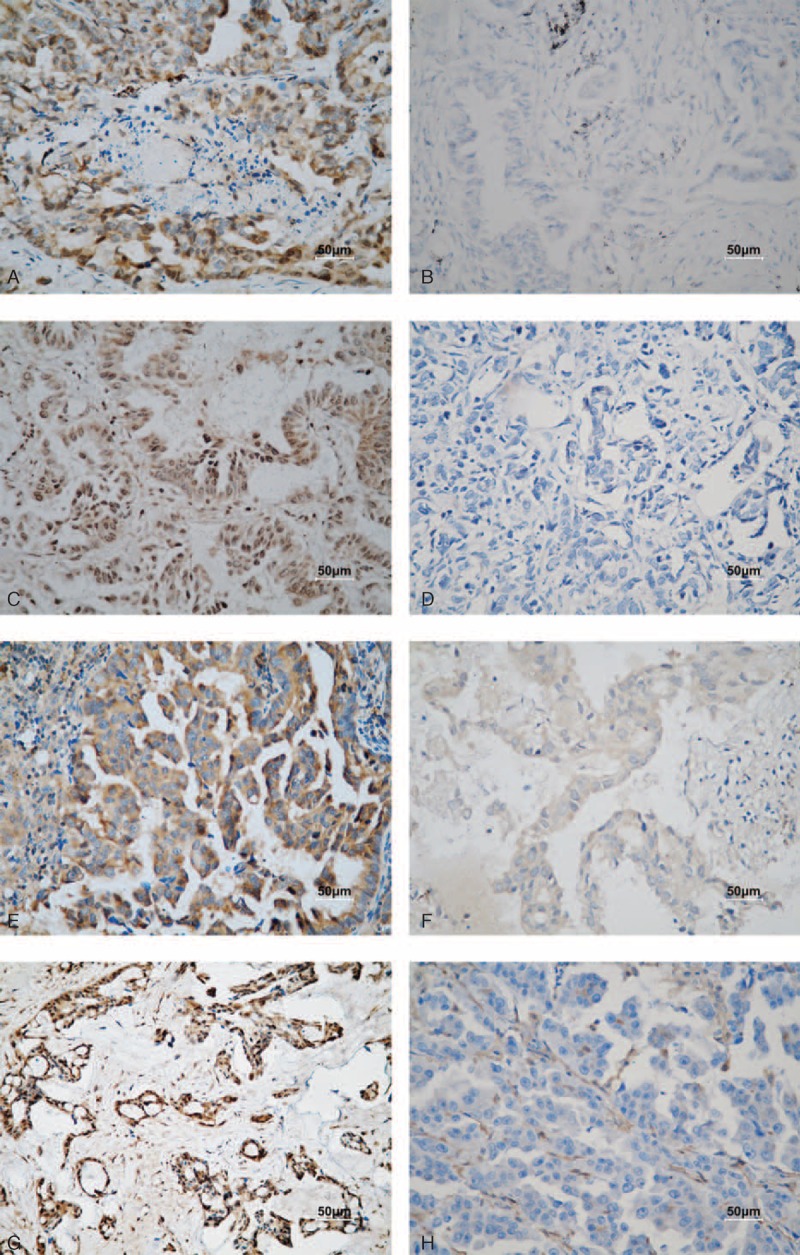
FIGURE 3.

Immunohistochemical staining of human NSCLC tissues (200× magnification). (A and B) Carcinoma with positive and negative thymidylate synthase expression. (C and D) Carcinoma with positive and negative dihydropyrimidine dehydrogenase expression. (E and F) Carcinoma with positive and negative orotate phosphoribosyltransferase expression. (H and I) Carcinoma with positive and negative thymidine phosphorylase expression. Scale bar, 50 μm.
