FIGURE 6.

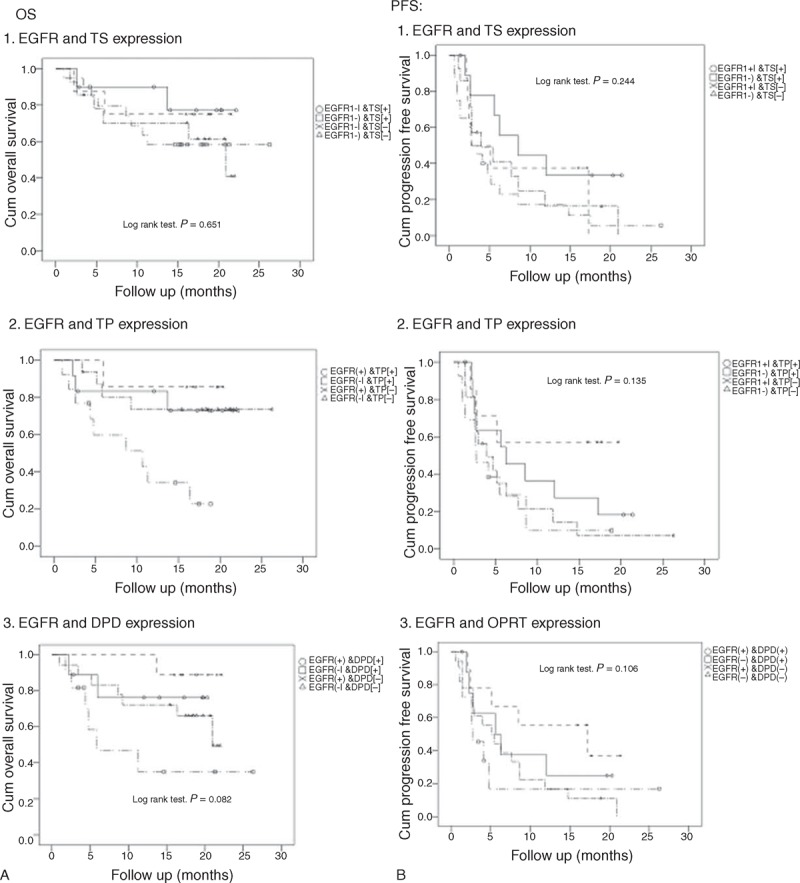
Survival analysis for OS and PFS according to EGFR mutation status and expression of thymidylate synthase (TS) (1), thymidine phosphorylase (TP) (2), and dihydropyrimidine dehydrogenase (DPD) (3).

Survival analysis for OS and PFS according to EGFR mutation status and expression of thymidylate synthase (TS) (1), thymidine phosphorylase (TP) (2), and dihydropyrimidine dehydrogenase (DPD) (3).