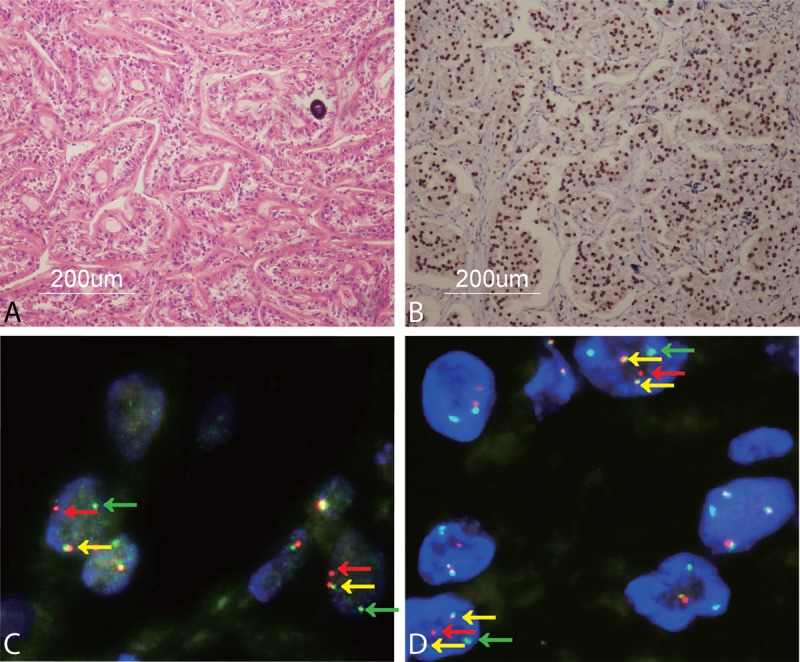
FIGURE 4.

A shows typical histopathology of ASPL-TFE3 RCC including voluminous cytoplasm, growth in a papillary pattern, and a psammoma body in case 1 (×100); B shows strong TFE3 IHC nuclear staining (×100); C shows a TFE3 break-apart FISH assay characterized by separated red and green signals (red and green arrowheads) and a fusion signal (yellow arrowheads) in tumor cell nuclei in case 1 (×1000); D shows ASPL-TFE3 dual-fusion FISH assay displaying 2 fusion signals (yellow arrowheads) in each tumor cell nucleus and 2 separated red and green signals (red and green arrowheads) in case 1 (×1000).
