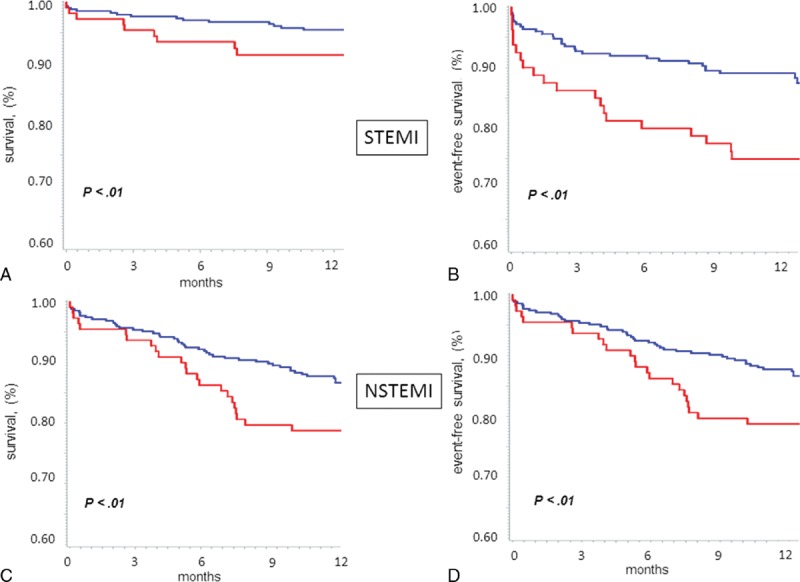
FIGURE 3.

Kaplan-Meier curve analysis stratified according to 25 (OH)D levels (the lowest quartile [red line] vs. the other 3 quartiles pooled together [blue line]) for 1-year mortality (Panels A and C), and for the combined end point (Panels B and D), in patients with ST-elevation myocardial infarction (STEMI) (upper panels) and non-ST elevation myocardial infarction (NSTEMI) (lower panels). P value by Log rank test.
