FIGURE 1.

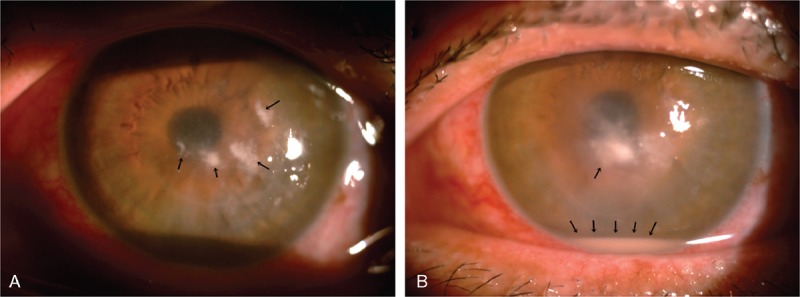
(A) Multiple satellite infiltrations (arrow) in the left eye. (B) One week later, the infiltration size increased; endothelium plaques and hypopyon (arrow) were also noted.

(A) Multiple satellite infiltrations (arrow) in the left eye. (B) One week later, the infiltration size increased; endothelium plaques and hypopyon (arrow) were also noted.