
FIGURE 1.
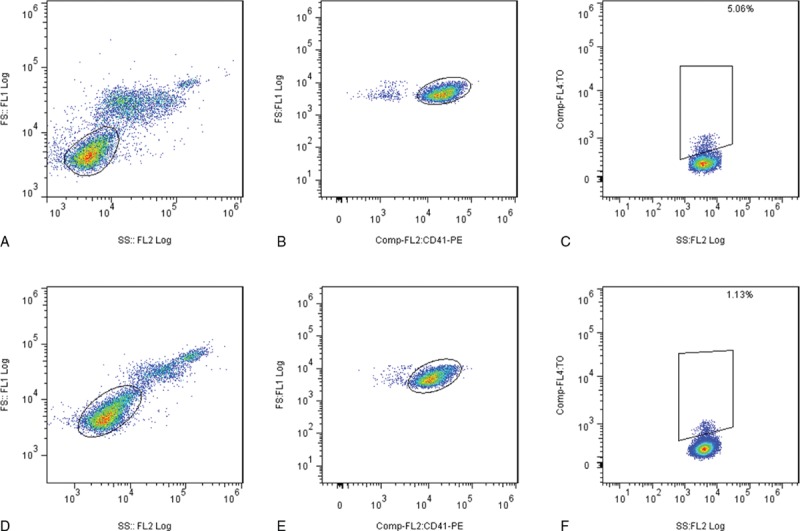
Gating strategies for RP% analysis. Selected patients from the non-surviving group (A, B, and C) and the surviving group (D, E, and F) are shown. Platelets after red blood cell lysis were first plotted in an FSC versus SSC scatter plot (A and D). The platelet population was then plotted in an FSC versus CD41 scatter plot to analyze and precisely determine the platelet population (B and E). The CD41+ population was plotted on the TO/SSC plot (C and F). Irregular gating was demonstrated because of volume-dependent background staining with TO. CD41+TO+ platelets of the appropriate size were viewed as RP. RP% = percentage of reticulated platelets, TO = thiazole orange.